 Download:
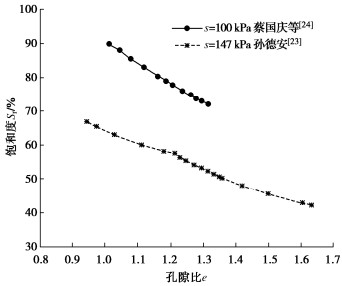
Relationship between saturation and void ratio
Figures of the Article
-
![]() Relationship between saturation and void ratio
Relationship between saturation and void ratio
-
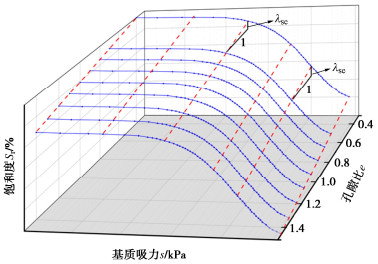
![]() Schematic diagram of soil-water characteristic curve under different void ratios
Schematic diagram of soil-water characteristic curve under different void ratios
-
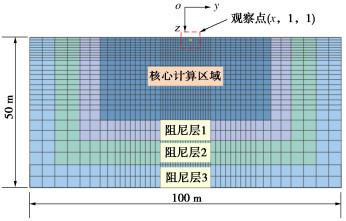
![]() Diagram of mesh distribution
Diagram of mesh distribution
-
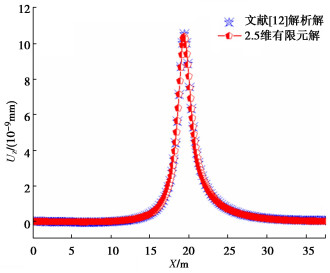
![]() Verification of single-phase elastic medium
Verification of single-phase elastic medium
-
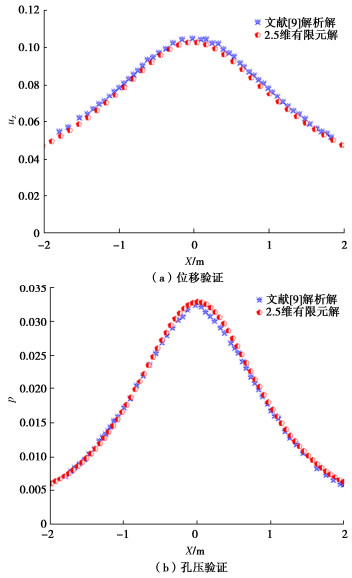
![]() Verification of two-phase saturated medium
Verification of two-phase saturated medium
-
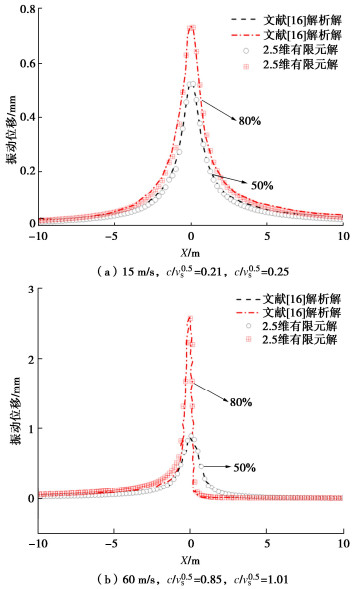
![]() Verification of three-phase unsaturated medium
Verification of three-phase unsaturated medium
-
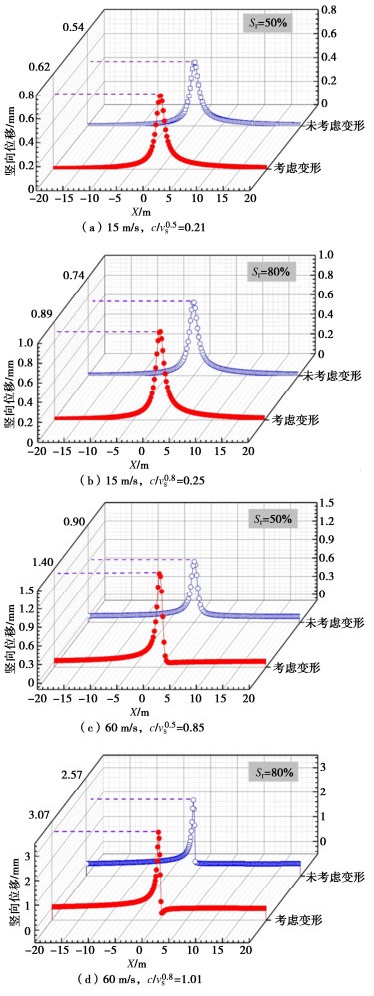
![]() Displacement responses under SWCC considering effect of deformation
Displacement responses under SWCC considering effect of deformation
-
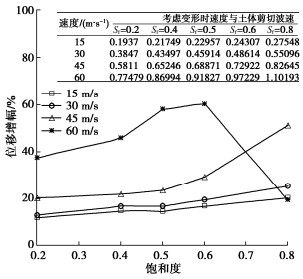
![]() Amplification of deformation and saturation considering different velocities
Amplification of deformation and saturation considering different velocities
Tables of the Article
-
Parameters of single-phase elastic medium[12]
Ks/GPa Kw/GPa Ka/kPa G/MPa n ρs/(kg·m-3) ρw/(kg·m-3) ρa/(kg·m-3) Sr 35 2.25 145 25 0.125 0.001 2500 0.001 0.001 0.001 -
Parameters of two-phase saturated medium[9]
Kb/MPa Ks/GPa Kw/GPa Ka/kPa G/MPa n ρs/(kg·m-3) ρw/(kg·m-3) ρa/(kg·m-3) Sr kD/(m·s-1) 8.77 11 2.25 145 2997.6 0.125 0.3 2500 1000 0.001 1 1×10⁻⁶ -
Parameters of unsaturated medium[16]
Kb/MPa Ks/GPa Kw/GPa Ka/kPa Gs/MPa n ρs/(kg·m-3) ρw/(kg·m-3) ρa/(kg·m-3) 8.33 35 2.25 145 3.85 0.35 0.45 2650 1000 1.28 Sr Sa ηw/(Ns·m-2) ηa/(Ns·m-2) Sw0 κ/m2 β/(Pa-1) m k φ' 0.5,0.8 0.5,0.2 0.001 18×10-6 0.05 5.3×10⁻¹³ 1.0×10⁻⁴ 0.5 2 10°
Related articles
-
2024, 46(12): 2591-2601. DOI: 10.11779/CJGE20230902
-
2021, 43(1): 62-68. DOI: 10.11779/CJGE202101007
-
2020, 42(S1): 11-15. DOI: 10.11779/CJGE2020S1003
-
2020, 42(11): 2059-2068. DOI: 10.11779/CJGE202011011
-
2019, 41(S2): 13-16. DOI: 10.11779/CJGE2019S2004
-
2018, 40(S1): 235-240. DOI: 10.11779/CJGE2018S1038
-
2018, 40(S1): 34-38. DOI: 10.11779/CJGE2018S1006
-
2015, 37(zk1): 148-155. DOI: 10.11779/CJGE2015S1029
-
2008, 30(3): 399-405.
