PDF format
24-202503-G23-0359⼀⽂审稿意见与作者答复 Download(2829KB)24-202503-G23-0359⼀⽂审稿意见与作者答复
Figures of the Article
-
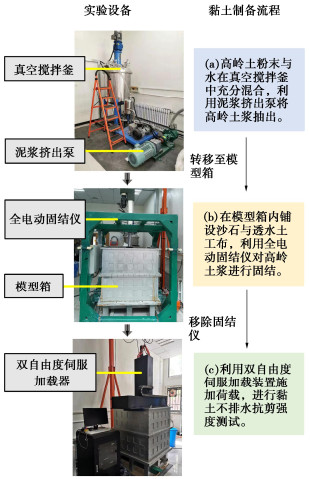
![]() Experimental equipment and clay preparation process
Experimental equipment and clay preparation process
-
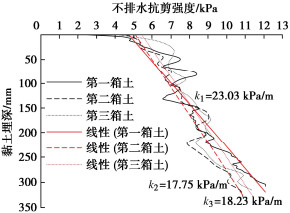
![]() T-bar undrained shear strength curve
T-bar undrained shear strength curve
-
![]() Plate anchor
Plate anchor
-
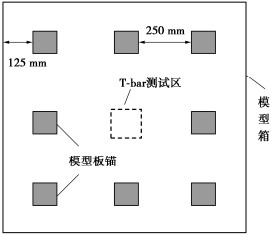
![]() Top view of plate anchor arrangement
Top view of plate anchor arrangement
-
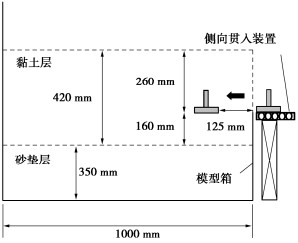
![]() Side view of plate anchor installation
Side view of plate anchor installation
-
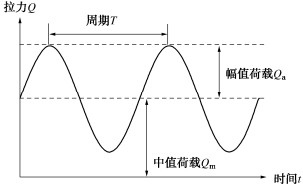
![]() Schematic diagram of repeated loading
Schematic diagram of repeated loading
-
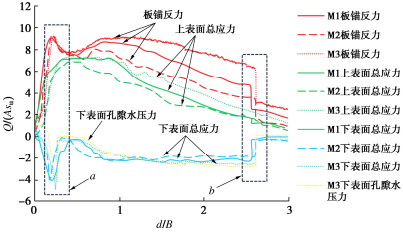
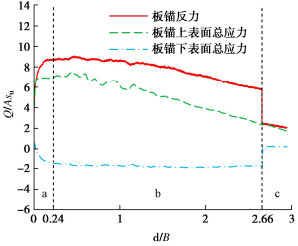
![]() The stress curve of the pull-up process
The stress curve of the pull-up process
-
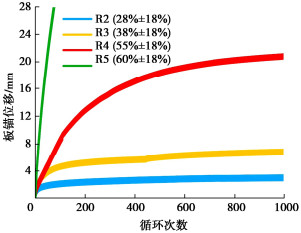
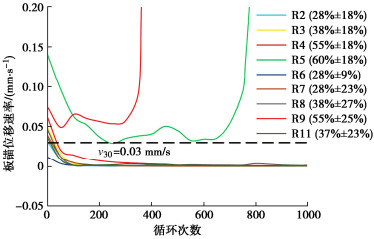
![]() Curve of plate anchor displacement and cycle index under different median repeated loadings
Curve of plate anchor displacement and cycle index under different median repeated loadings
-
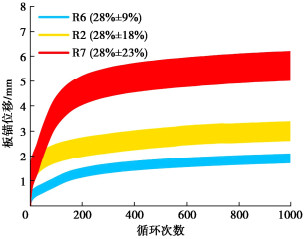
![]() Curve of plate anchor displacement and cycle index under different amplitude repeated loadings
Curve of plate anchor displacement and cycle index under different amplitude repeated loadings
-
![]() Effect of repeated loading on displacement rate
Effect of repeated loading on displacement rate
-
![]() The stress curve of the pull-up process of experiment R11
The stress curve of the pull-up process of experiment R11
-
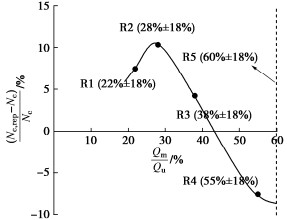
![]() Effect of median repeated loading on bearing capacity
Effect of median repeated loading on bearing capacity
-
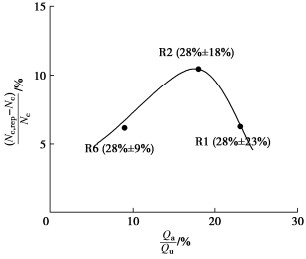
![]() Effect of amplitude repeated loading on bearing capacity
Effect of amplitude repeated loading on bearing capacity
-
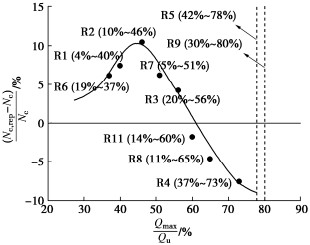
![]() Influence of peak value of repeated loading on bearing capacity
Influence of peak value of repeated loading on bearing capacity

Tables of the Article
-
Experimental arrangement
试验编号 荷载类型 Qm/Qu
/%Qa/Qu
/%实际循环次数 试验箱号 M1
M2
M3单调荷载
单调荷载
单调荷载—
—
——
—
——
—
—1
2
3R1 往复荷载 22 18 1000 2 R2 往复荷载 28 18 1000 1 R3 往复荷载 38 18 1000 1 R4 往复荷载 55 18 1000 1 R5 往复荷载 60 18 780 2 R6 往复荷载 28 9 1000 1 R7 往复荷载 28 23 1000 1 R8 往复荷载 38 27 1000 1 R9
R11往复荷载
往复荷载55
3725
23384
10001
3 -
Ultimate bearing capacity coefficient of plate anchor
来源 Nc 本文试验M1 9.10 本文试验M2 9.30 本文试验M3 9.24 Merifield等[8] 11.86 Merifield等[9] 11.90 Gaudin等[5] 12.3~13.5 Song等[10] 11.7 Das[2] 9 -
Bearing capacity coefficient of repeated drawing experiment
试验编号 QmQu/% QaQu/% Nc, rep (Nc,rep−Nc)Nc/% 初始埋深损失/mm R1 22 18 10.00 7.53 — R2 28 18 10.05 10.44 3.06 R3 38 18 9.49 4.28 6.88 R4
R555
6018
188.42
FAIL-7.47
—20.81
—R6 28 9 9.66 6.15 1.93 R7 28 23 9.67 6.26 5.76 R8
R9
R1138
55
3727
25
238.68
FAIL
9.08-4.61
—
-1.7310.53
—
8.04
