PDF format
07-202306-G22-0229一文审稿意见与作者答复 Download(10550KB)07-202306-G22-0229一文审稿意见与作者答复
Figures of the Article
-
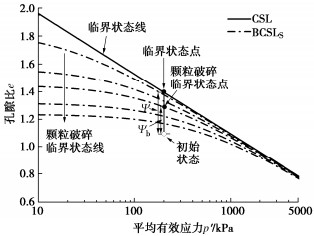
![]() Schematic diagram of critical state line of breakage
Schematic diagram of critical state line of breakage
-
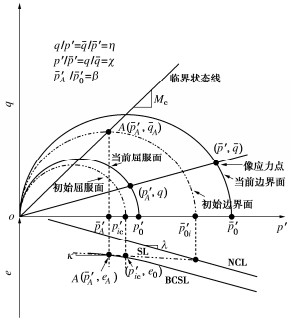
![]() Schematic diagram of yield surface, bounding surface and hardening law
Schematic diagram of yield surface, bounding surface and hardening law
-
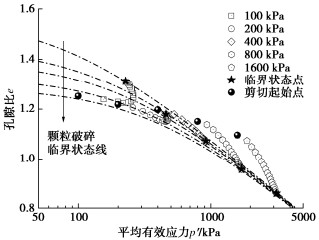
![]() Evolution of BCSL in compression plane
Evolution of BCSL in compression plane
-
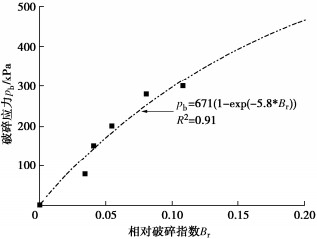
![]() Relationship between breakage stress and index
Relationship between breakage stress and index
-
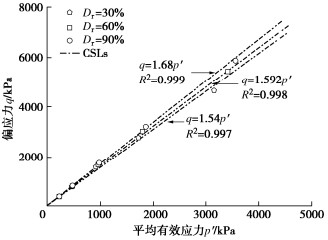
![]() CSLs in $q$-$p'$ plane[34]
CSLs in $q$-$p'$ plane[34]
-
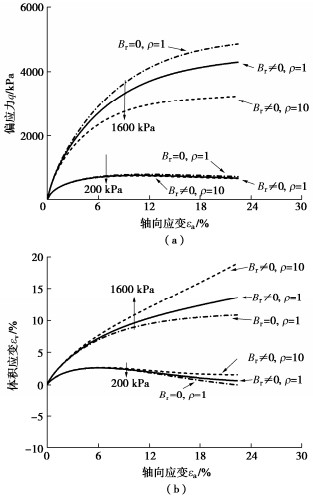
![]() Analysis of model parameters on simulations
Analysis of model parameters on simulations
-
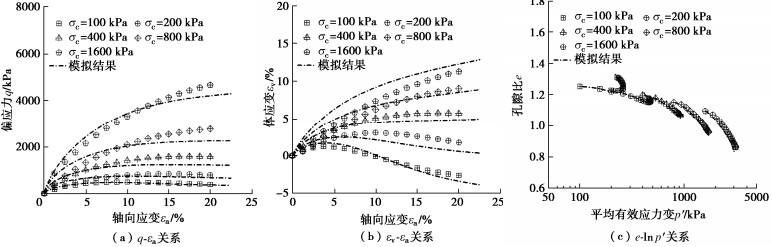
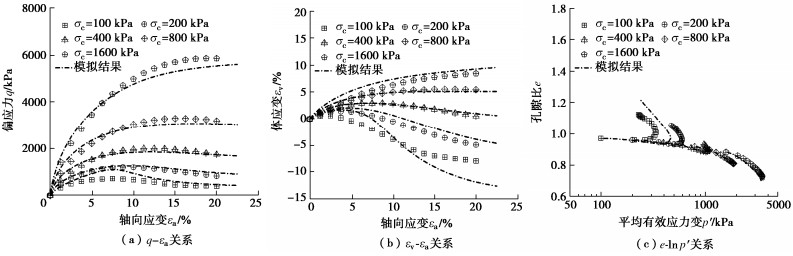
![]() Comparison between simulations and test data[33]with ${D_r}$=30%
Comparison between simulations and test data[33]with ${D_r}$=30%
-
![]() Comparison between simulations and test data[33]with ${D_r}$=60%
Comparison between simulations and test data[33]with ${D_r}$=60%
-
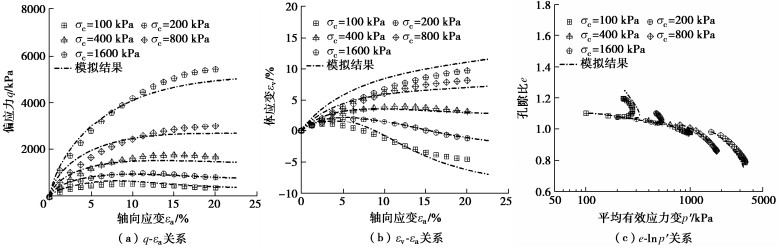
![]() Comparison between simulations and test data[33]with ${D_r}$=90%
Comparison between simulations and test data[33]with ${D_r}$=90%