| λ | κ | υ | M | $\varepsilon _{{\text{dr}}}^{\text{p}}$ | χ | μ |
| 0.042 | 0.004 | 0.3 | 1.35 | 0.07 | -0.392 | 1.51 |
 Download:
Export CSV
Download:
Export CSV
Model parameters of frozen soils
Figures of the Article
-
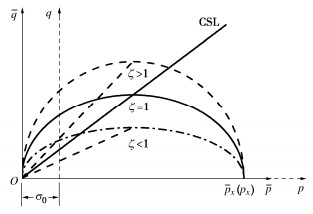
![]() Yield curves for frozen soils in different stress spaces
Yield curves for frozen soils in different stress spaces
-
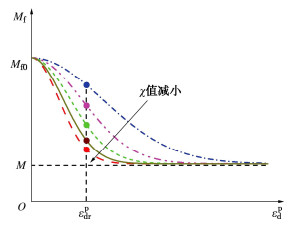
![]() Evolution of potential strength Mf
Evolution of potential strength Mf
-
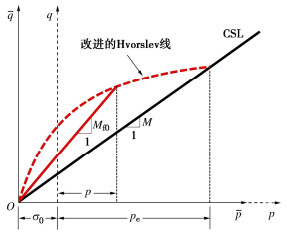
![]() Improved Hvorslev surface
Improved Hvorslev surface
-
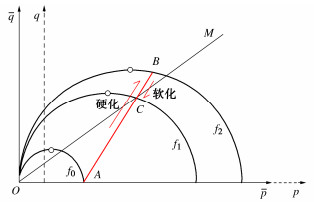
![]() Evolution of yield surface under triaxial compression stress path
Evolution of yield surface under triaxial compression stress path
-
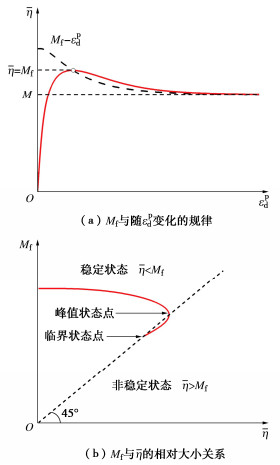
![]() Evolution of Mf and $\bar \eta $
Evolution of Mf and $\bar \eta $
-
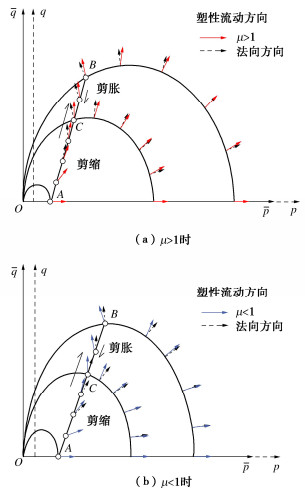
![]() Evolution of plastic flow direction
Evolution of plastic flow direction
-
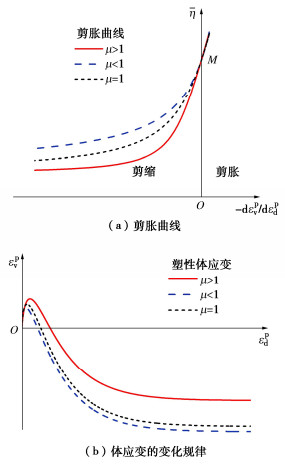
![]() Variation rules of volume during shearing
Variation rules of volume during shearing
-
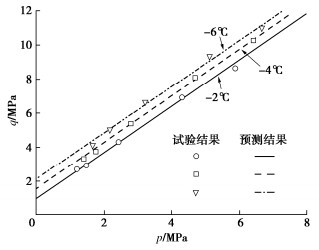
![]() Shear strength lines for frozen soils at different temperatures
Shear strength lines for frozen soils at different temperatures
-
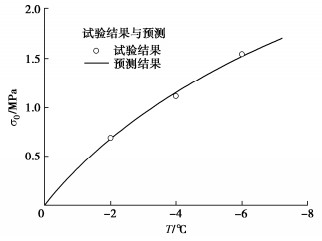
![]() Fitting curve of three-dimensional tensile strength and temperature of frozen soils
Fitting curve of three-dimensional tensile strength and temperature of frozen soils
-
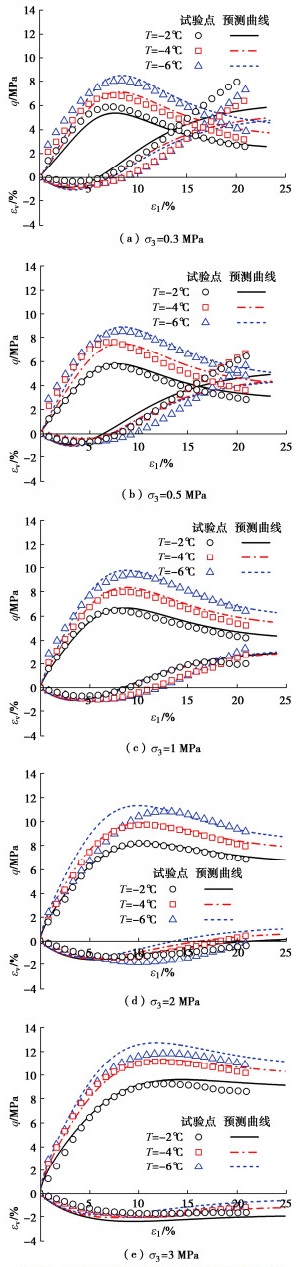
![]() Comparison of test results and model predictions for frozen soils
Comparison of test results and model predictions for frozen soils