 Download:
Figures of the Article
-
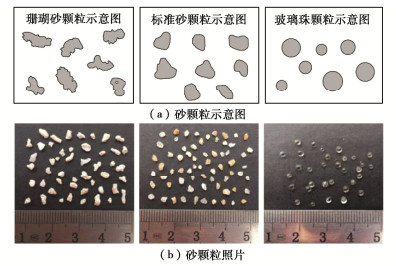
![]() Comparison of shapes of coral calcareous sand, quartz sand particles and spherical glass beads(from Ren Yubin et al. [14])
Comparison of shapes of coral calcareous sand, quartz sand particles and spherical glass beads(from Ren Yubin et al. [14])
-
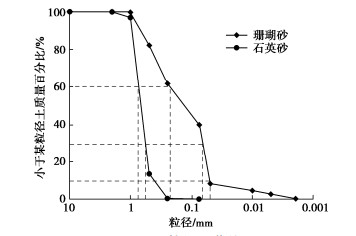
![]() Grain-size distribution curves
Grain-size distribution curves
-
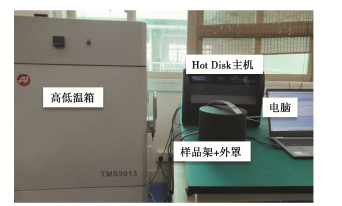
![]() Photos of Hot Disk TPS 2500S
Photos of Hot Disk TPS 2500S
-
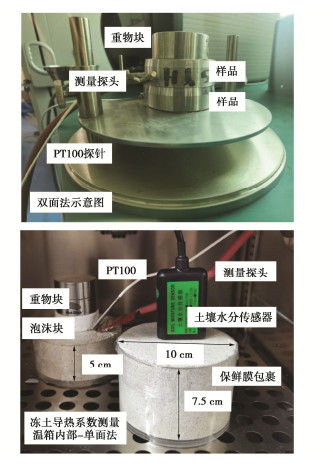
![]() Configuration of tests
Configuration of tests
-
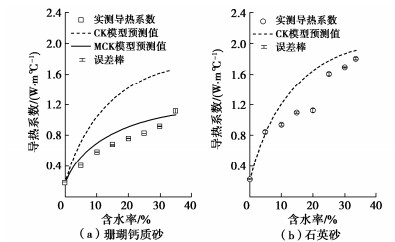
![]() Comparison between measured and predicted thermal conductivities of unfrozen sand
Comparison between measured and predicted thermal conductivities of unfrozen sand
-
![]() Schematic diagram of heat conduction between unfrozen sand particles
Schematic diagram of heat conduction between unfrozen sand particles
-
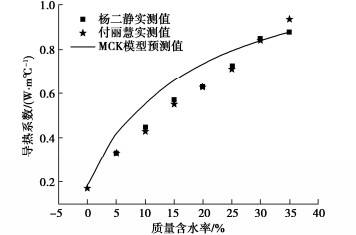
![]() Validation of modified model
Validation of modified model
-
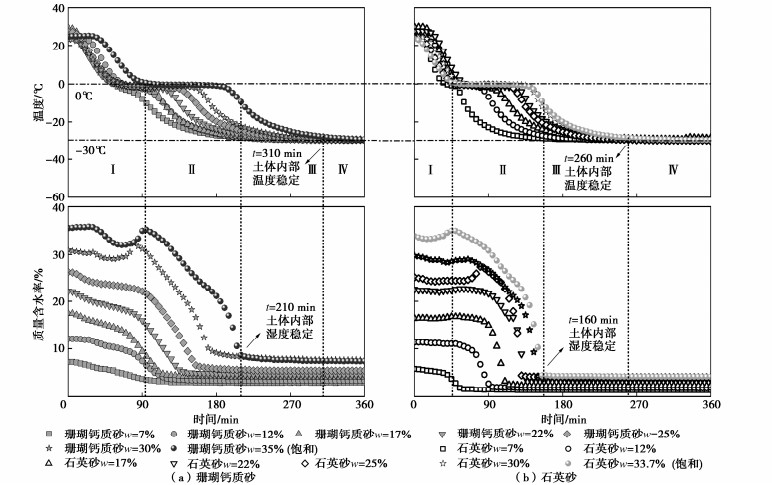
![]() Change of internal temperature and mass moisture content of sand during freezing
Change of internal temperature and mass moisture content of sand during freezing
-
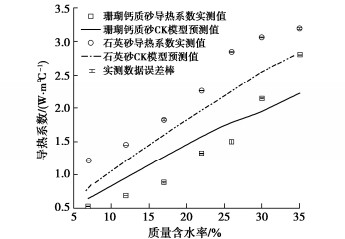
![]() Measured data and model prediction results of thermal conductivity of frozen sand
Measured data and model prediction results of thermal conductivity of frozen sand
-
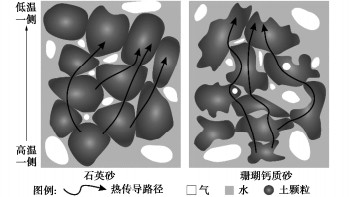
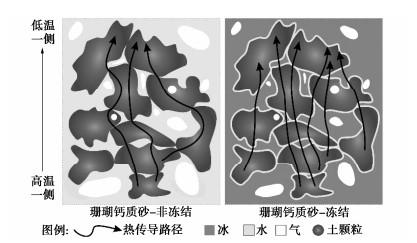
![]() Difference of heat conduction paths between frozen and nonfrozen coral calcareous sand
Difference of heat conduction paths between frozen and nonfrozen coral calcareous sand
Tables of the Article
-
Volume percentages and thermal conductivities of each mineral component
土样 珊瑚砂 石英砂 导热系数${\lambda _{{\text{mj}}}}$/(W/m℃) 文石 47.3% 0 2.24 方解石 50.3% 0 3.59 石英 2.4% 50.3% 7.69 斜长石 0 26.9% 2.49 钠长石 0 22.8% 1.96 注:少量含量小于1%的矿物不进行具体计算。 -
Parameters of CK and MCK models[8, 14]
土样 $ {\lambda _{{\text{sat}}}} $/
(W·m-1·℃-1)${\lambda _{{\text{dry}}}}$/
(W·m-1·℃-1)a ${\lambda _{\text{w}}}$
(W·m-1·℃-1)${\rho _{\text{w}}}$/
(g·cm-3)${\rho _{\text{s}}}$/
(g·cm-3)$\chi $/
(W·m-1·℃-1)$\eta $ ${\lambda _{\text{i}}}$/
(W·m-1·℃-1)$\mu $ $\psi $ 非冻结珊瑚砂 1.35 0.19 3.55 0.6 1 1.4 0.75 1.2 2.24 0.782 0.528 冻结珊瑚砂 1.35 0.19 0.95 0.6 1 1.4 0.75 1.2 2.24 0.782 0.528 非冻结石英砂 1.67 0.20 3.55 0.6 1 1.4 0.75 1.2 2.24 — 0.675 冻结石英砂 1.67 0.20 0.95 0.6 1 1.4 0.75 1.2 2.24 — 0.675 非冻结珊瑚砂[21] 1.35 0.19 3.55 0.6 1 1.2 0.75 1.2 2.24 0.782 0.528 非冻结珊瑚砂[28] 1.35 0.19 3.55 0.6 1 1.2 0.75 1.2 2.24 0.782 0.528 -
Error analysis of thermal conductivity for unfrozen soils
土样 模型 温度/
℃MAE/
(W·m-1·℃-1)RMSE/ (W·m-1·℃-1) MAPE/% 石英砂 CK 25 ± 5 0.128 0.024 12.0 珊瑚砂 CK 25 ± 5 0.286 0.098 40.0 珊瑚砂 MCK 25 ± 5 0.098 0.011 15.0 珊瑚砂[21] MCK 20 0.072 0.007 15.6 珊瑚砂[28] MCK 20 0.019 0.001 2.8 -
Error analysis of thermal conductivity evaluation models of frozen sand
土样 测试温度/℃ MAE/
(W·m·℃-1)RMSE/
(W·m·℃-1)MAPE/
%石英砂 -30 0.301 0.110 25 珊瑚砂 -30 0.393 0.183 18
