Figures of the Article
-
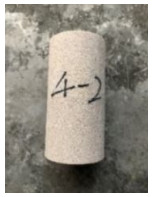
![]() Freeze-thaw test block of sandstone
Freeze-thaw test block of sandstone
-
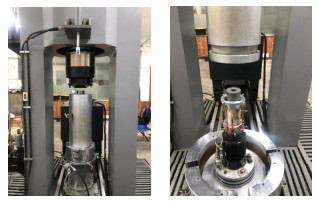
![]() TZW-3000II rock true triaxial rheological testing machine
TZW-3000II rock true triaxial rheological testing machine
-
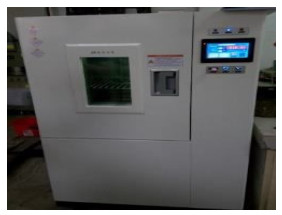
![]() WGD-501 vertical freeze-thaw machine
WGD-501 vertical freeze-thaw machine
-
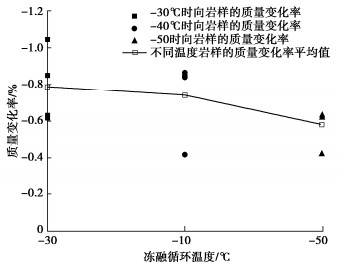
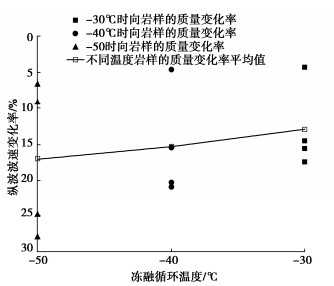
![]() Variation of mass change rate with temperature of freeze-thaw cycle
Variation of mass change rate with temperature of freeze-thaw cycle
-
![]() Variation of change rate of longitudinal wave velocity with temperature of freeze-thaw cycle
Variation of change rate of longitudinal wave velocity with temperature of freeze-thaw cycle
-
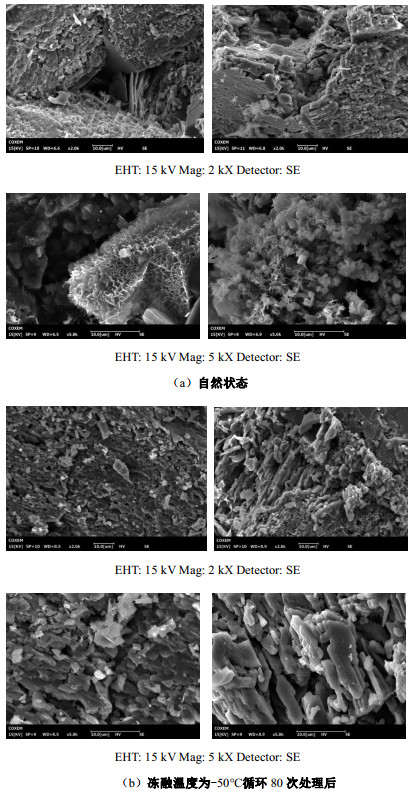
![]() Surface microstructures of sandstone in natural state and after 80 freeze-thaw cycles
Surface microstructures of sandstone in natural state and after 80 freeze-thaw cycles
-
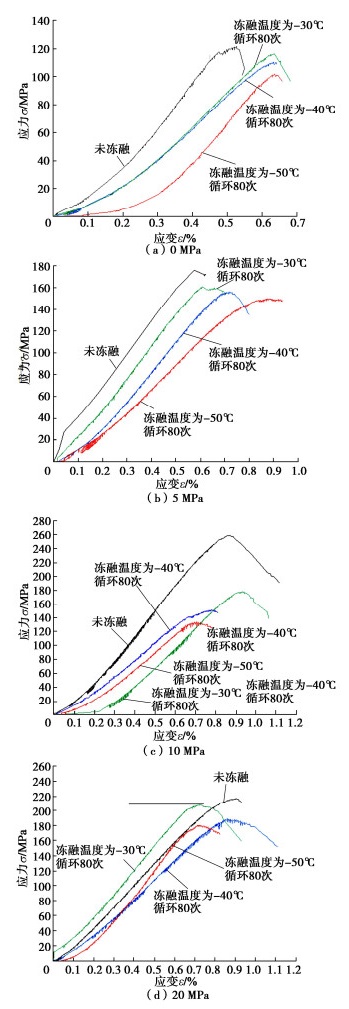
![]() Stress-strain curves under different confining pressures and freeze-thaw temperatures
Stress-strain curves under different confining pressures and freeze-thaw temperatures
-
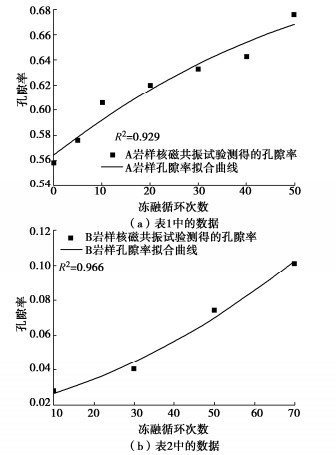
![]() Fitting curves of porosity with number of freeze-thaw cycles
Fitting curves of porosity with number of freeze-thaw cycles
-
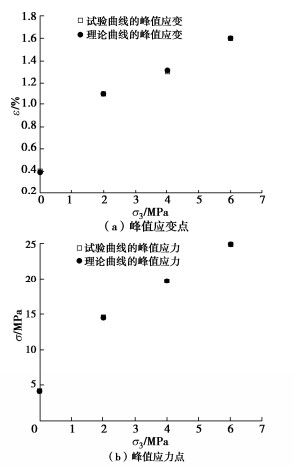
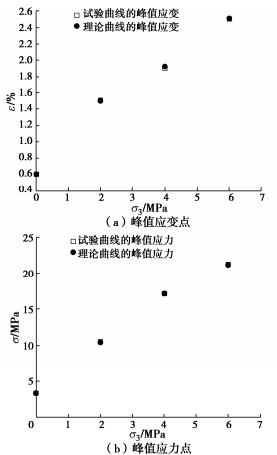
![]() Peak points of experimental and theoretical curves under different confining pressures after 0 freeze-thaw cycle
Peak points of experimental and theoretical curves under different confining pressures after 0 freeze-thaw cycle
-
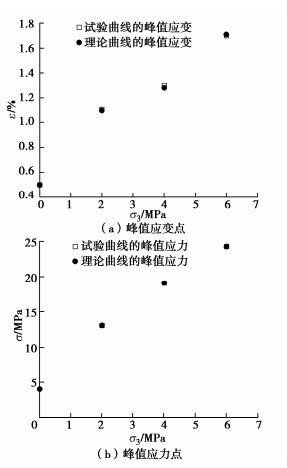
![]() Peak points of experimental and theoretical curves under different confining pressures after 5 freeze-thaw cycles
Peak points of experimental and theoretical curves under different confining pressures after 5 freeze-thaw cycles
-
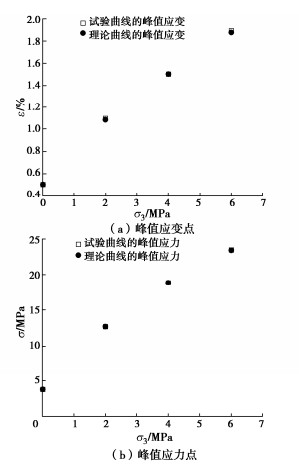
![]() Peak points of experimental and theoretical curves under different confining pressures after 10 freeze-thaw cycles
Peak points of experimental and theoretical curves under different confining pressures after 10 freeze-thaw cycles
-
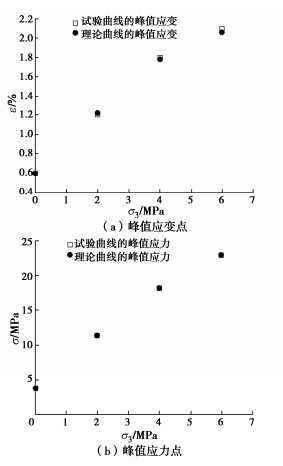
![]() Peak points of experimental and theoretical curves under different confining pressures after 20 freeze-thaw cycles
Peak points of experimental and theoretical curves under different confining pressures after 20 freeze-thaw cycles
-
![]() Peak points of experimental and theoretical curves under different confining pressures after 40 freeze-thaw cycles
Peak points of experimental and theoretical curves under different confining pressures after 40 freeze-thaw cycles
Tables of the Article
-
NMR porosities of rock samples under different freeze-thaw cycles
冻融循环次数 0 5 10 20 30 40 50 孔隙率ϕn/% 5.58 5.76 6.06 6.20 6.33 6.43 6.76 -
NMR porosities of rock samples
冻融循环次数 10 30 50 70 孔隙率ϕn/% 2.83 4.09 7.43 10.13 -
Fitting values of NMR porosity of rock samples under different freeze-thaw cycles
冻融循环次数 0 5 10 20 40 孔隙率拟合值/% 2.062 2.355 2.83 3.502 5.662 -
Model parameters of red sandstone under different freeze-thaw cycles and confining pressures
冻融次数 σ3/MPa σp /MPa εp /% m F0/MPa 0 0 4.230 0.4 4.634 1.987 2 14.572 1.1 6.869 3.369 4 19.652 1.3 17.460 3.383 6 24.866 1.6 25.257 3.406 5 0 4.020 0.5 3.127 1.653 2 13.101 1.1 6.556 3.120 4 19.132 1.3 13.958 3.113 6 24.347 1.7 10.828 3.607 10 0 3.800 0.5 3.225 1.651 2 12.701 1.1 4.287 3.124 4 18.910 1.5 5.562 3.602 6 23.519 1.9 5.116 3.880 20 0 3.749 0.6 3.007 1.466 2 11.356 1.2 2.701 2.678 4 18.100 1.8 2.887 3.591 6 22.903 2.1 3.499 4.031 40 0 3.301 0.6 1.286 0.836 2 10.570 1.5 1.408 2.197 4 17.121 1.9 2.367 3.492 6 21.274 2.5 2.121 3.722
