 Download:
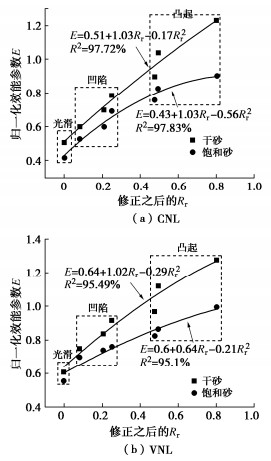
Normalized interface friction coefficient versus corrective corrected roughness Rr
Figures of the Article
-
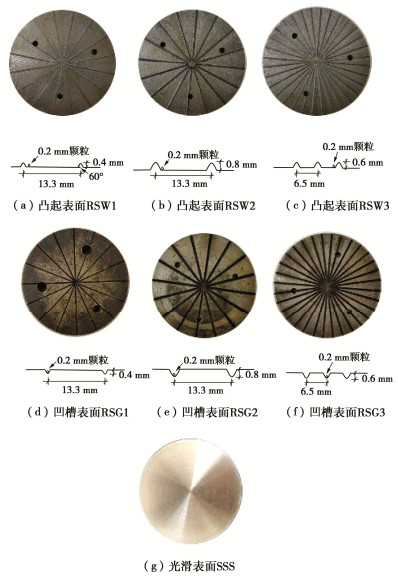
![]() Steel plates used in tests
Steel plates used in tests
-
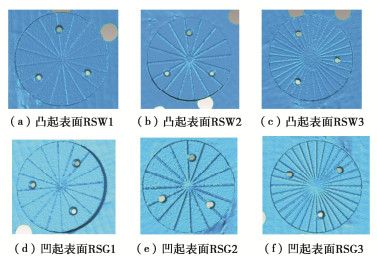
![]() Laser-scanned images of different rough surfaces
Laser-scanned images of different rough surfaces
-
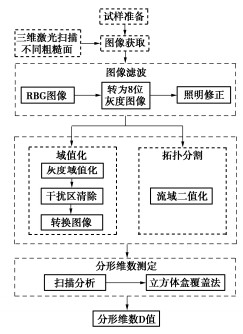
![]() Flow chart of surface fractal dimension calculated by Image J software
Flow chart of surface fractal dimension calculated by Image J software
-
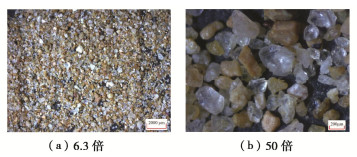
![]() Microscopic images of quartz sand particles
Microscopic images of quartz sand particles
-
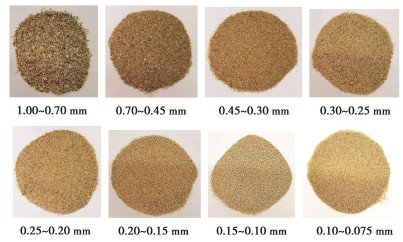
![]() Sand particles at different ranges of grain sizes
Sand particles at different ranges of grain sizes
-
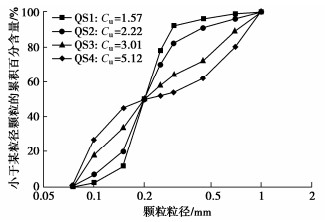
![]() Grain size distributions of the testing soils
Grain size distributions of the testing soils
-
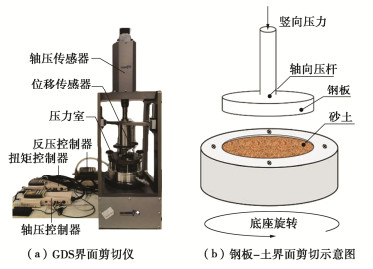
![]() GDS interface shear apparatus
GDS interface shear apparatus
-
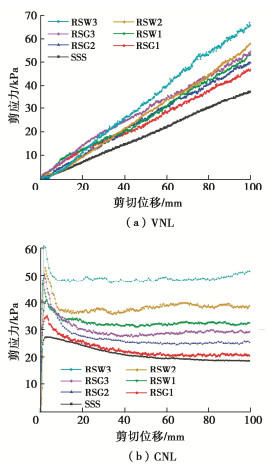
![]() Curves of shear stress-shear displacement for different interfaces under VNL and CNL conditions
Curves of shear stress-shear displacement for different interfaces under VNL and CNL conditions
-
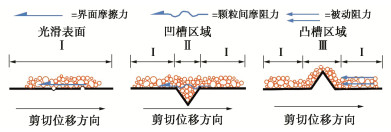
![]() Mobilization mechanism of interface shear strength
Mobilization mechanism of interface shear strength
-
![]() Interface friction coefficient versus interface roughness Rr
Interface friction coefficient versus interface roughness Rr
-
![]() Interface friction coefficient versus interface roughness Ra
Interface friction coefficient versus interface roughness Ra
-
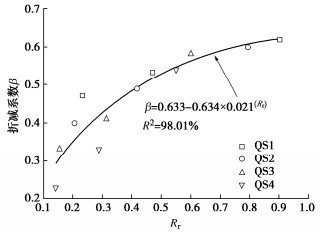
![]() Curves of interface roughness reduction factor-roughness Rr
Curves of interface roughness reduction factor-roughness Rr
-
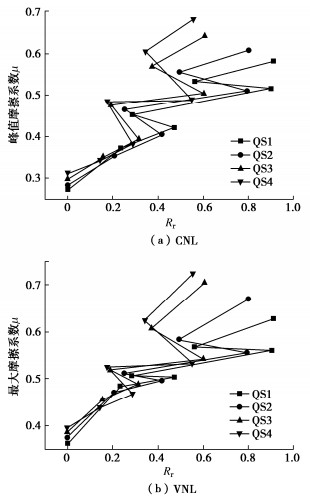
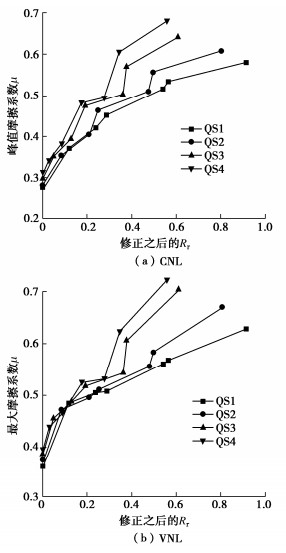
![]() Interface friction coefficient versus corrective interface roughness $ {R_{\text{r}}} $
Interface friction coefficient versus corrective interface roughness $ {R_{\text{r}}} $
-
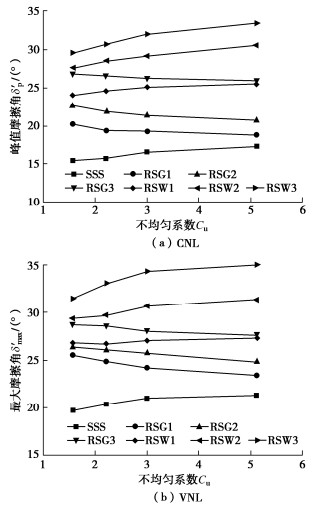
![]() Variations of interface friction angle with Cu
Variations of interface friction angle with Cu
-
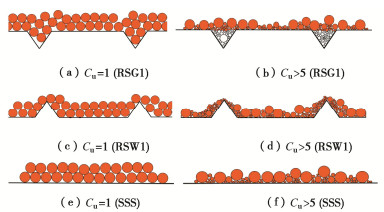
![]() Interpretation of interface interactions
Interpretation of interface interactions
-
![]() Normalized interface friction coefficient versus corrective corrected roughness Rr
Normalized interface friction coefficient versus corrective corrected roughness Rr

Tables of the Article
-
Soil properties
编号 Cu Cc D50/
mmDav/
mm相对密实度Dr/% emax emin 砂样质量/g QS1 1.57 0.99 0.20 0.22 90 1.10 0.61 129.81 QS2 2.22 1.23 0.25 1.01 0.56 128.67 QS3 3.01 0.80 0.33 0.98 0.63 124.28 QS4 5.12 0.33 0.36 1.02 0.65 122.63 -
Surface roughnesses of different interfaces
表面类型 Rmax/mm Rn Ra/mm D Rr QS1 QS2 QS3 QS4 SSS 0 0 0 0 0 0 0 0 RSW1 0.4 2 0.0365 1.7252 0.286 0.252 0.191 0.175 RSW2 0.8 4 0.0678 1.8269 0.563 0.495 0.375 0.344 RSW3 0.6 3 0.1043 1.9251 0.913 0.803 0.608 0.558 RSG1 0.4 2 0.0365 1.421 0.236 0.207 0.157 0.144 RSG2 0.8 4 0.0678 1.5376 0.474 0.417 0.316 0.290 RSG3 0.6 3 0.1043 1.9047 0.903 0.795 0.602 0.552 -
Shear tests on saturated interfaces
表面类型 试样 CNL/
kPaVNL/
kPa剪切位移
L/mm剪切速率/
(cm·min-1)SSS, RSW1,
RSW2, RSW3,
RSG1, RSG2,
RSG3QS1,
QS2,
QS3,
QS4100 0~100 100 1.0
