Figures of the Article
-
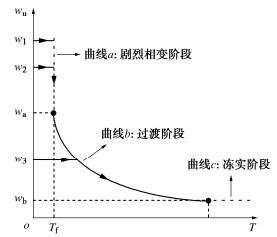
![]() Freezing characteristic curve of Michalowski model
Freezing characteristic curve of Michalowski model
-
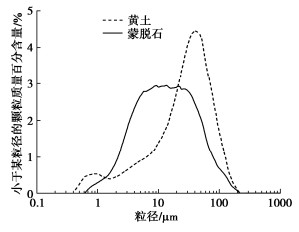
![]() Grain-size distribution curves of soil
Grain-size distribution curves of soil
-
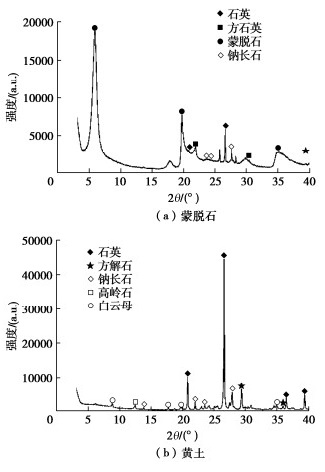
![]() Spectra of XRD diffraction of soils
Spectra of XRD diffraction of soils
-
![]() Change curves of water content of samples with different initial water contents during cooling process
Change curves of water content of samples with different initial water contents during cooling process
-
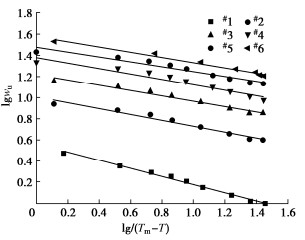
![]() Power law relationship between unfrozen water content wu and temperature (Tm-T)
Power law relationship between unfrozen water content wu and temperature (Tm-T)
-
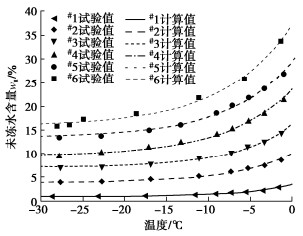
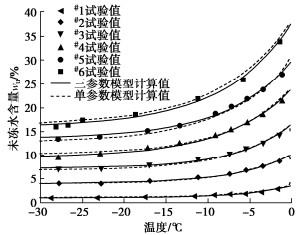
![]() Freezing characteristic curves of three-parameter Michalowski model
Freezing characteristic curves of three-parameter Michalowski model
-
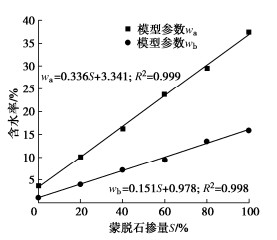
![]() Relationship curves between model parameters and montmorillonite content
Relationship curves between model parameters and montmorillonite content
-
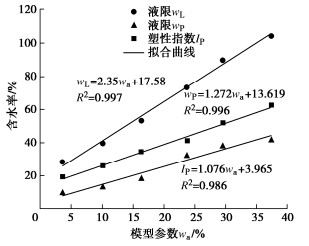
![]() Relationship curves between model parameter wa and Atterberg limits
Relationship curves between model parameter wa and Atterberg limits
-
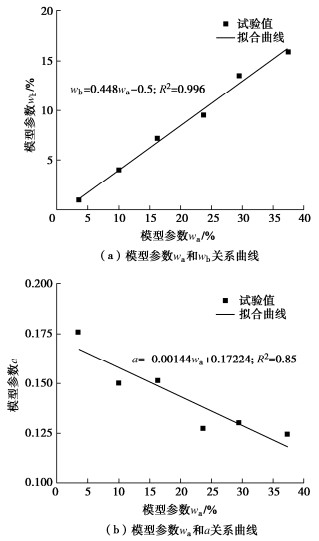
![]() Relationship curve between model parameters
Relationship curve between model parameters
-
![]() Freezing characteristic curves of single-parameter Michalowski model
Freezing characteristic curves of single-parameter Michalowski model
-
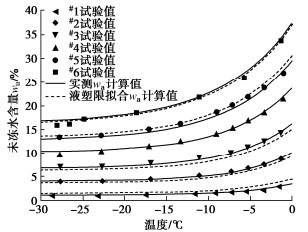
![]() Freezing characteristic curves calculated by liquid limit
Freezing characteristic curves calculated by liquid limit

Tables of the Article
-
Physical properties of soils
土样编号 蒙脱石掺量S/% 土颗粒相对密度 塑限wP/% 液限wL/% 塑性指数IP #1 0 2.71 19.2 28.3 9 #2 20 — 26.1 39.6 14 #3 40 — 34.6 53.3 19 #4 60 — 41.3 73.4 32 #5 80 — 51.8 89.8 38 #6 100 2.45 62.2 104.5 42 -
Parameters of fitting curve
土体编号 斜率k 截距m 相关系数R2 #1 -0.38 0.56 0.99 #2 -0.28 1.01 0.97 #3 -0.25 1.22 0.98 #4 -0.26 1.38 0.95 #5 -0.23 1.47 0.95 #6 -0.24 1.58 0.98 -
Parameters of Michalowski model
土体编号 wa/% wb/% a #1 3.58 0.99 0.18 #2 10.09 3.99 0.15 #3 16.32 7.19 0.15 #4 23.75 9.53 0.13 #5 29.58 13.48 0.13 #6 37.38 15.94 0.12
