| 密度/(kg·m-3) | 弹性模量/GPa | 泊松比 | 黏聚力/kPa | 内摩擦角/(°) |
| 2200 | 8 | 0.3 | 400 | 31 |
 Download:
Export CSV
Download:
Export CSV
Parameters of DP model
Figures of the Article
-
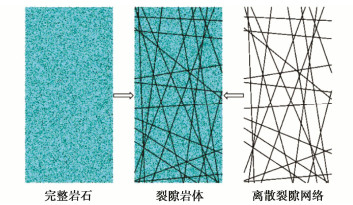
![]() Model of synthetic rock mass
Model of synthetic rock mass
-
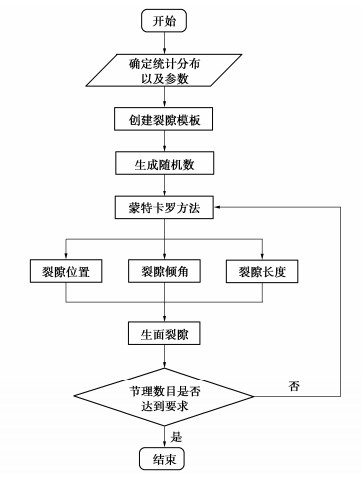
![]() Generation of random discrete fracture network
Generation of random discrete fracture network
-
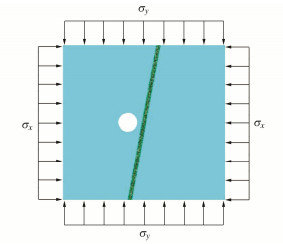
![]() Simulation of tunnel excavation near fault
Simulation of tunnel excavation near fault
-
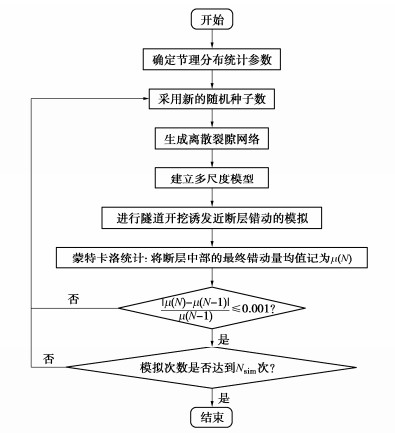
![]() Simulation process
Simulation process
-
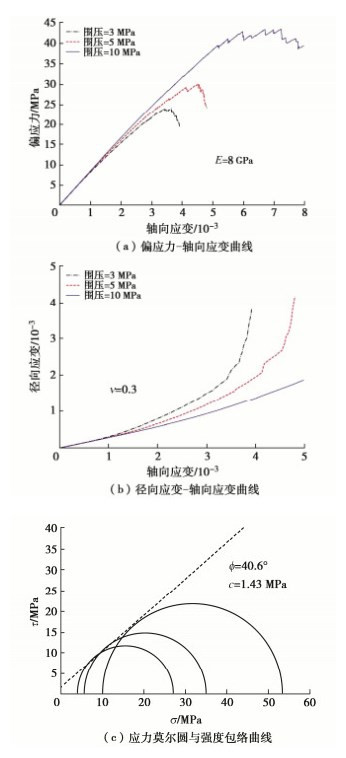
![]() Parameter calibration for surrounding rock
Parameter calibration for surrounding rock
-
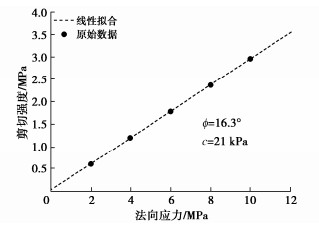
![]() Parameter calibration for joints
Parameter calibration for joints
-
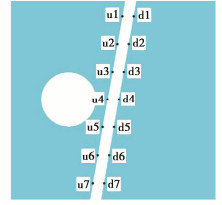
![]() Locations of monitoring points
Locations of monitoring points
-
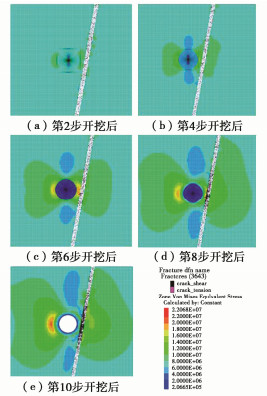
![]() Stress nephograms during excavation process for Case S13
Stress nephograms during excavation process for Case S13
-
![]() Fault dislocations during excavation process for Case S13
Fault dislocations during excavation process for Case S13
-
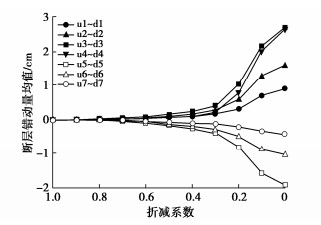
![]() Dislocations at different monitoring points
Dislocations at different monitoring points
-
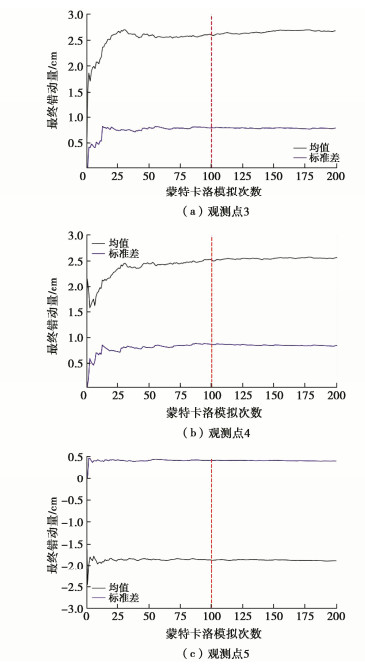
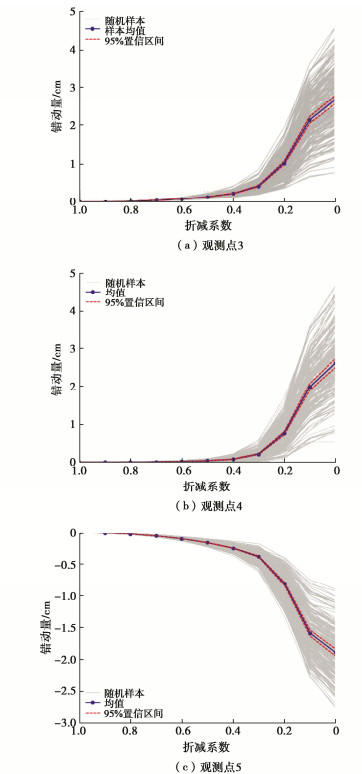
![]() Simulated results considering randomness of joints
Simulated results considering randomness of joints
-
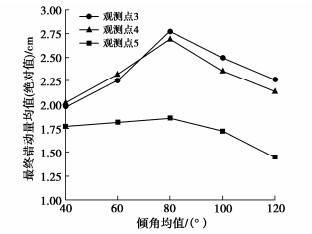
![]() Mean of dislocation (absolute) vs. mean of dip
Mean of dislocation (absolute) vs. mean of dip
-
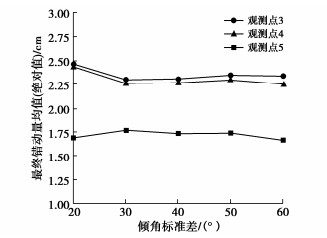
![]() Mean of dislocation (absolute) vs. standard deviation of dip
Mean of dislocation (absolute) vs. standard deviation of dip
-
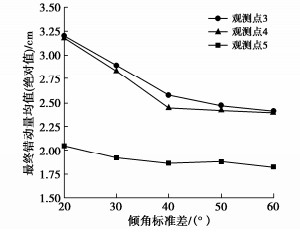
![]() Mean of dislocation vs. when = 80°
Mean of dislocation vs. when = 80°
-
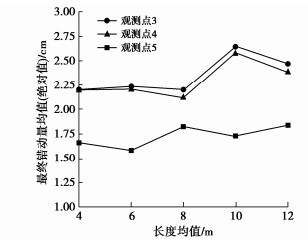
![]() Mean of dislocation (absolute) vs. mean of length
Mean of dislocation (absolute) vs. mean of length
-
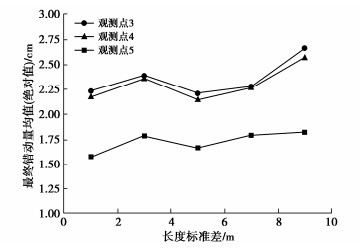
![]() Mean of dislocation(absolute) vs.
Mean of dislocation(absolute) vs.
-
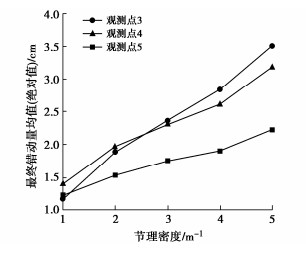
![]() Mean of dislocation (absolute) vs. joint density
Mean of dislocation (absolute) vs. joint density
Tables of the Article
-
Parameters of DP model
密度/(kg·m-3) 弹性模量/GPa 泊松比 黏聚力/kPa 内摩擦角/(°) 2200 8 0.3 400 31 -
Parameters of parallel bonded model
线性组 平行黏结组 有效模量/GPa 刚度比 摩擦系数 有效模量/GPa 刚度比 摩擦角/(°) 抗拉强度/MPa 黏结强度/MPa 6.5 3.6 0.577 6.5 3.6 85 12 10 -
Parameters of smooth-joint model and corresponding macroscopic parameters
细观参数 宏观参数 法向刚度/GPa 切向刚度/GPa 黏结强度/kPa 抗拉强度/kPa 摩擦因数 黏聚力/kPa 摩擦角/(°) 20 6 4 1 0.3 21 16.3 -
Orthogonal design table
编号 μdip/(°) σdip/(°) μlen/m σlen/m FD S1 40 20 4 1 1 S2 40 30 8 7 5 S3 40 40 12 3 4 S4 40 50 6 9 3 S5 40 60 10 5 2 S6 60 20 12 7 3 S7 60 30 6 3 2 S8 60 40 10 9 1 S9 60 50 4 5 5 S10 60 60 8 1 4 S11 80 20 10 3 5 S12 80 30 4 9 4 S13 80 40 8 5 3 S14 80 50 12 1 2 S15 80 60 6 7 1 S16 100 20 8 9 2 S17 100 30 12 5 1 S18 100 40 6 1 5 S19 100 50 10 7 4 S20 100 60 4 3 3 S21 120 20 6 5 4 S22 120 30 10 1 3 S23 120 40 4 7 2 S24 120 50 8 3 1 S25 120 60 12 9 5 -
Results of multivariate analysis of variance of dislocation at monitoring point No. 3
均值 误差平方和 自由度 均方 F检验值 p值 截距 138.255 1 138.225 741.732 0.000** 节理倾角均值 1.688 4 0.422 2.264 0.224 节理倾角标准差 0.082 4 0.021 0.11 0.972 节理长度均值 0.791 4 0.198 1.061 0.478 节理长度标准差 0.705 4 0.176 0.946 0.521 节理密度 15.848 4 3.962 21.26 0.006** 残差 0.745 4 0.186 R2 = 0.962 * p < 0.05 ** p < 0.01 -
Results of multivariate analysis of variance of dislocation at monitoring point No. 4
均值 误差平方和 自由度 均方 F检验值 p值 截距 132.951 1 132.951 621.294 0.000** 节理倾角均值 1.337 4 0.334 1.562 0.338 节理倾角标准差 0.123 4 0.031 0.144 0.956 节理长度均值 0.685 4 0.171 0.801 0.583 节理长度标准差 0.569 4 0.142 0.665 0.649 节理密度 8.978 4 2.245 10.489 0.021* 残差 0.856 4 0.214 R2 = 0.932 * p < 0.05 ** p < 0.01 -
Results of multivariate analysis of variance of dislocation at monitoring point No. 5
均值 误差平方和 自由度 均方 F检验值 p值 截距 74.61 1 74.61 2209.555 0.000** 节理倾角均值 0.511 4 0.128 3.783 0.113 节理倾角标准差 0.035 4 0.009 0.261 0.889 节理长度均值 0.241 4 0.06 1.783 0.295 节理长度标准差 0.207 4 0.052 1.532 0.345 节理密度 2.864 4 0.716 21.206 0.006** 残差 0.135 4 0.034 R2 = 0.966 * p < 0.05 ** p < 0.01
Related articles
-
2021, 43(6): 1097-1108. DOI: 10.11779/CJGE202106013
-
2020, 42(S2): 20-25. DOI: 10.11779/CJGE2020S2004
-
2020, 42(1): 181-187. DOI: 10.11779/CJGE202001021
-
2015, 37(zk2): 202-209. DOI: 10.11779/CJGE2015S2039
-
2013, 35(zk2): 422-427.
-
2013, 35(zk2): 207-211.
-
2013, 35(6): 1018-1026.
-
2012, 34(11): 2100-2107.
-
2011, 33(sup2): 339-344.
-
2010, 32(12): 1837-1845.
