PDF format
09-202306-G22-0243一文审稿意见与作者答复 Download(419KB)09-202306-G22-0243一文审稿意见与作者答复
Figures of the Article
-
![]() Measurement of thermal conductivity of samples subjected to different temperatures
Measurement of thermal conductivity of samples subjected to different temperatures
-
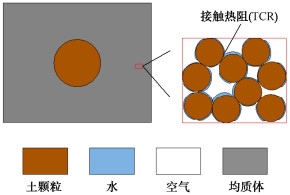
![]() Structural diagram of Leong model
Structural diagram of Leong model
-
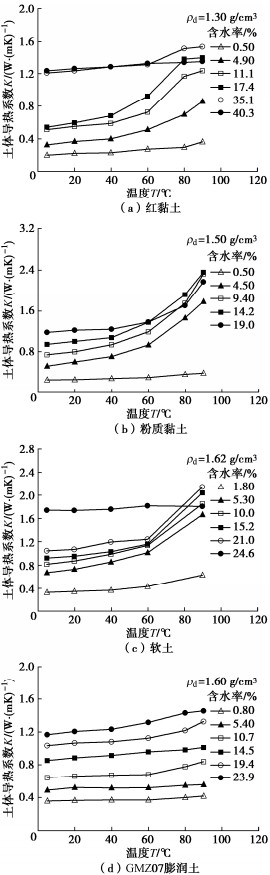
![]() Change in thermal conductivity of samples with different water contents with temperature
Change in thermal conductivity of samples with different water contents with temperature
-
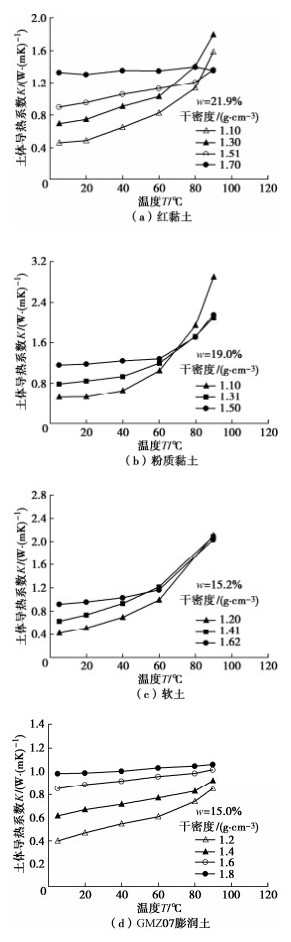
![]() Change in thermal conductivity of samples with different dry densities with temperature
Change in thermal conductivity of samples with different dry densities with temperature
-
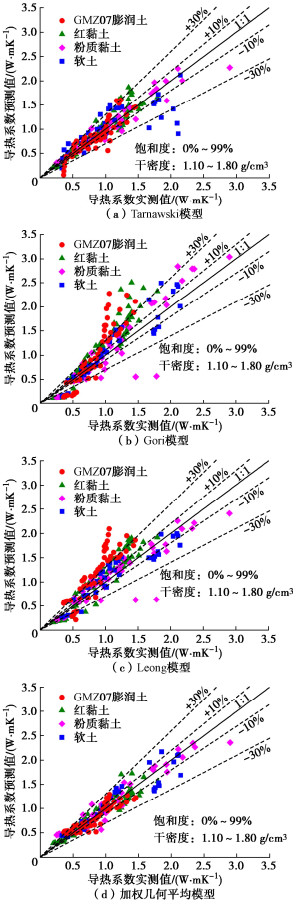
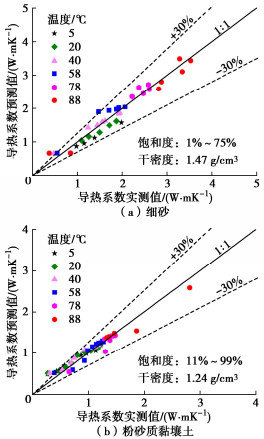
![]() Comparison of measured and predicted thermal conductivities of soil
Comparison of measured and predicted thermal conductivities of soil
-
![]() Comparison between predicted and measured values of average geometric model
Comparison between predicted and measured values of average geometric model
-
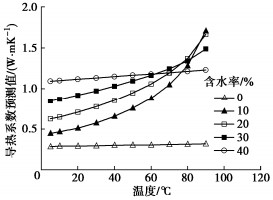
![]() Prediction of influences of water content on temperature effects of thermal conductivity of soil
Prediction of influences of water content on temperature effects of thermal conductivity of soil
-
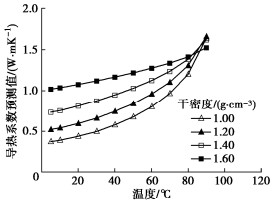
![]() Prediction of influences of dry density on temperature effects of thermal conductivity of soil
Prediction of influences of dry density on temperature effects of thermal conductivity of soil

Tables of the Article
-
Physical property indexes of soil samples
土样 相对质量密度 液限/ % 塑限/% 塑性指数 颗粒级配/% 砂粒2~0.05 mm 粉粒0.05~0.002 mm 黏粒 < 0.002 mm 红黏土 2.74 61.8 38.1 23.7 7.89 47.02 45.09 粉质黏土 2.72 27.6 16.5 11.1 27.10 52.54 20.36 软土 2.73 40.6 20.5 20.1 3.75 69.44 26.81 GMZ07膨润土 2.76 163.0 32.0 131.0 — 56.40 43.60 -
Mineral compositions of soil samples
土样 蒙脱石 高岭石 伊利石 长石 石英 其他 红黏土 — 50.7 12.0 9.9 12.7 14.7 粉质黏土 — 51.0 19.0 — 11.5 18.5 软土 — — 31.2 — 23.0 45.8 GMZ07膨润土 62.0 — — 11.0 10.0 17.0 单位: %
