
Stochastic analysis of fault dislocation induced by tunnel excavation considering distribution characteristics of joints in fracture zones
-
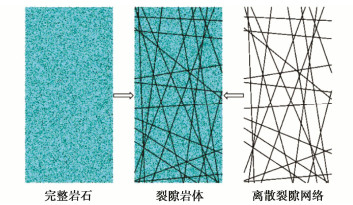
摘要: 隧道开挖往往会引起邻近断层错动,并进一步诱发岩爆、地震等灾害。然而,断层破碎带内部岩体物理力学特征复杂,不仅表现出非连续性、非线性和各向异性,还存在节理随机分布特征,隧道开挖诱发近断层错动机制仍不清晰。基于连续-离散耦合分析方法建立了含断层工程场地多尺度力学模型,采用基于离散单元法的人工合成岩体模型模拟断层破碎带,采用有限差分法描述断层上、下盘及内部隧道开挖影响下的宏观动力特征。开展了近断层隧道开挖多因素模拟,探究了断层岩体节理随机分布特征对近断层隧道开挖的影响规律。分析结果表明:破碎带内部节理随机性对隧道开挖诱发近断层错动影响显著;节理倾角均值越接近断层倾角,隧道开挖导致的近断层错动量越大;正交试验情况下,断层节理倾角方差对最终错动量均值大小影响较小;节理长度的均值和方差越大,断层破碎带越容易发生错动;节理密度越大,破碎带介质越破碎,断层带整体的强度和刚度越低,抵抗错动的能力也越弱。通过对比分析得出节理分布特征参数对断层错动量均值影响程度的排序分布:节理密度 > 节理倾角均值> 节理长度均值> 节理长度标准差 > 节理倾角标准差;且当显著性水平为0.05时,节理密度对断层错动量的影响达到显著水平(p < 0.05)。Abstract: Tunnel excavation often causes the dislocation of adjacent faults, and further induces rockbursts, earthquakes and other disasters. Due to the complex physical and mechanical characteristics of rock mass, the fault exhibits discontinuity, nonlinear and anisotropy and has the random distribution of joints, which makes the mechanism of adjacent fault dislocation induced by tunnel excavation still unclear. A multi-scale model is established based on the continuous-discrete coupling method. The synthetic rock mass model based on the discrete element method is used to simulate the fault damage zone, and the finite difference method is used to describe the macroscopic dynamic characteristics of the upper and lower walls. The influence laws of the random distribution characteristics of joints on the excavation simulation of a near-fault tunnel are explored. The results show that the randomness of joints in the fracture zone has a significant effect on fault dislocation. The fault dislocation increases with the mean dip angle of joints closer to that of fault. In the case of orthogonal tests, the variance of dip angle has small effects on the mean value of final dislocation. The increase of the mean and variance of joint length causes the fault prone to dislocation. The greater the joint density, the more broken the media in the fracture zone, the lower the overall strength and stiffness, and the weaker the resistance to dislocation. Through a comparative analysis, the influence degree of distribution characteristic parameters of joints on the mean value of fault dislocation is: density > mean value of dip angle > mean value of length > standard deviation of length > standard deviation of dip angle. When the significance level is 0.05, the influences of joint density on the momentum of fault dislocation reach a significant level (p < 0.05).
-
Keywords:
- fault dislocation /
- multi-scale coupling /
- randomness /
- tunnel excavation
-
0. 引言
土石坝变形的预测和控制是设计和运行的一个关键问题,其变形预测常采用数值计算手段,计算时的模型参数常采用三轴试验确定。随着高土石坝工程的不断涌现,筑坝堆石料直径逐渐加大,堆石坝最大粒径一般可达800~1200 mm,而常规三轴压缩试验试样直径为300 mm,其试验粒径更是被缩尺后限制到60 mm以内[1],这就带来了试验材料趋同性及由试验参数向原型筑坝材料参数回溯推求等问题[2-4]。为解决尺寸效应问题,有学者采用超大型三轴仪或是现场硐室压缩试验以减小缩尺的影响[5-7],但试验可重复性差且推广性不足。
通过系列比例的缩尺试验,研究力学参数随缩尺比例的变化规律,提出从缩尺堆石料推求原型堆石料力学参数的外推方程,是解决尺寸效应问题的另一种研究途径[8],本研究推导建立了三维应力条件下球体材料变形特性参数尺寸效应理论模型,并开展了堆石料和砂砾石料在120~1000 mm试样尺度下的系列压缩实验,研究压缩模量的尺寸效应变化规律,通过破碎前后堆石料筛分试验,揭示破碎率的影响规律,并验证尺寸效应理论模型。
1. 土石料尺寸效应理论模型
1.1 尺寸效应统一模型
土石料的堆积结构单元为堆石(或砂卵石)颗粒,为从理论层面建立尺寸效应模型,将堆石颗粒简化为球体开展三维应力条件下推导,篇幅所限此处仅给出结过,推导过程见笔者发表的文献[9, 10]。
基于堆石料压缩模量随尺度参数的变化关系和压缩模量随颗粒破碎率的变化关系,建立考虑破碎修正的堆石料尺寸效应模型:
Ei=f(Br)⋅F(Rd,e0,E,μ) 。 (1) 式中:F(Rd,e0,E,μ)为尺寸效应方程,公式为
F(Rd,e0,E,μ)=1(1+2k0)π[a⋅exp(−Rdb)](ρdGsρw)ξE1−μ2, (2) 式中:Ei为堆石料压缩模量;E和μ分别为堆石料弹性模量与泊松比;Gs为堆石料相对质量密度;a和b为模型参数;k0为侧压力系数(k0=μ1−μ)。
f(Br)为破碎修正方程,公式为
f(Br)=e−λRdβ。 (3) 式中:f(Br)为破碎修正函数;Rd为径径比;λ,β为方程参数。
1.2 破碎修正参量
土石料在压力所用下整体变形除了一部分为形变,还有一部分是由破碎引起的,由于颗粒破碎对压缩模量具有重要的影响,对颗粒破碎对尺寸效应影响进行专门分析,采用破碎修正方程式(3),分别讨论可破碎和不可破碎的土石料的尺寸效应变化规律。
参数λ是描述颗粒破碎程度的参数,λ=0表示破碎率为0,无颗粒破碎情况,而且,λ越大则颗粒破碎程度越大。将破碎系数λ=0,0.5,1.0,2.0,3.0代入尺寸效应统一模型式(1),得到考虑破碎修正的归一化压缩模量与径径比关系曲线,如图 1所示。
![]() 图 1 可破碎与不可破碎材料的尺寸效应曲线Figure 1. Size effect curves of crushable and non crushable materials
图 1 可破碎与不可破碎材料的尺寸效应曲线Figure 1. Size effect curves of crushable and non crushable materials从图 1可以看出,当没有颗粒破碎(λ=0)时,压缩模量随径径比增加而减小;当破碎程度较低时(λ=0.5),小径径比区段(约为Rd≤6)的压缩模量显著降低,出现了曲线反向、压缩模量随径径比增大而增大的现象,大径径比区段(约为Rd > 6)曲线变化趋势保持不变;随着破碎程度增加,尺寸效应曲线基本完全变为压缩模量随径径比增加而增加的变化曲线。
2. 压缩模量尺寸效应试验研究
2.1 试验设计
针对土石料尺寸效应问题,采用可反映破碎效应的堆石料和不发生破碎的砂砾石料进行侧限压缩试验,并在试验后进行筛分试验以研究压缩模量随颗粒破碎率的变化规律。试验设计时,为体现尺寸效应规律,突破常规300 mm直径试样筒的条件,对堆石料和砂砾石料同时开展试样直径为120~1000 mm、装样最大粒径5~200 mm、径径比从5~25的的系列试验,试验方案如表 1所示,设计级配如图 2所示。
表 1 尺寸效应试验方案Table 1. The size effect test plan径径比Rd 装样最大粒径/mm 试件直径D/mm 5 200 1000 12.5 80 25 40 5 100 500 12.5 40 25 20 6 20 120 12 10 24 5 试验参照《土工试验方法标准:GB/T 50123—2019》进行,各组试验密度控制在1.88 g/cm3,加载速率为0.01 H/min,当轴向应变15%或轴向应力达到6 MPa时停止加载,以保证土石料处于弹性应变状态。
2.2 试验结果及分析
对各组试样进行侧限压缩试验,典型应力应变曲线如图 3所示,对其进行线性拟合,相关系数均达到0.95以上,斜率作为试验压缩模量。
试验中既有不同的试件尺寸,也有不同的最大粒径,为将两者统一引入径径比的参量进行对比分析,各组试验所得压缩模量与径径比的关系如图 4所示。
![]() 图 4 压缩模量与径径比关系曲线Figure 4. Compression modulus and diameter to diameter ratio relationship curve
图 4 压缩模量与径径比关系曲线Figure 4. Compression modulus and diameter to diameter ratio relationship curve可以看出,有破碎效应的堆石料压缩模量随径径比增加而增加,但增加的幅值随径径比的增大逐渐减小;无破碎效应的砂砾石料压缩模量随径径比增加而减小。综合来看,尽管各组试验中的试样尺寸和最大粒径不同,但只要试样径径比相同,所测得的压缩模量非常接近,说明在其他条件相同情况下,径径比是影响压缩模量的主要因素。
2.3 颗粒破碎影响分析
土石料作为一个整体结构在外力作用发生压缩变形,在微观层面当某个或某些颗粒的边缘棱角发生破碎,这种现象在整个结构中累积将在宏观层面表现出形变,进行体现出压缩模量显著降低,为此,有必要研究压缩模量与颗粒破碎率的相关关系。
根据《土工试验方法标准:GB/T 50123—2019》对各组试验在压缩前后进行颗粒筛分试验,绘出堆石料和砂砾石料压缩前后典型颗粒分析曲线如图 5所示。
从图中可以看出,砂砾石料压缩前后基本无变化,而堆石料压缩后颗分曲线位于压缩前曲线上方,表明在试验中颗粒发生了破碎。
以Hardin提出的相对破碎率指标Br为评价破碎的程度,可得砂砾石试验后的破碎率为0.34%,可忽略其影响,按不可破碎材料分析;堆石料试验后的破碎率为2.7%~5.3%,建立压缩模量Ei与破碎率Br的关系曲线,如图 6所示。由图可得,破碎率越大则压缩模量越小,说明颗粒破碎将降低堆石结构变形模量,进一步建立径径比与相对破碎率关系如图 7所示,相对破碎率随径径比增加而减小,呈幂函数关系,将此关系采用式(3)表示,堆石料破碎修正因子为f(Br)=exp(−1.25Rd0.383)。
![]() 图 6 堆石料相对破碎率与压缩模量关系Figure 6. Relationship between relative crushing rate and compressive modulus of rockfill materials
图 6 堆石料相对破碎率与压缩模量关系Figure 6. Relationship between relative crushing rate and compressive modulus of rockfill materials![]() 图 7 堆石料相对破碎率与径径比关系Figure 7. Relationship between relative crushing rate and diameter to diameter ratio of rockfill materials
图 7 堆石料相对破碎率与径径比关系Figure 7. Relationship between relative crushing rate and diameter to diameter ratio of rockfill materials2.4 尺寸效应模型应用
基于砂砾石料不破碎的特性,对于式(1)的尺寸效应模型应用中无破碎修正项,根据压缩试验结果和材料参数E=7751.3 MPa,μ=0.197,ρd=1.88 g/cm3代入式(2)建立联立方程组,求解得到模型参数如表 1所示。将Rd=1.0作为压缩模量归一化的基准E0,绘出归一化压缩模量Ei/E0与径径比Rd关系曲线,如图 8(a)所示,可以看出,试验数据点落在模型计算曲线附近,相关系数R2为0.91。
堆石料在试验过程中发生了破碎,在尺寸效应模型应用时应考虑破碎修正项f(Br)的因素,根据压缩试验结果、破碎修正因子方程和材料参数E=4320 MPa,μ=0.37,ρd=1.88 g/cm3,求解得到模型参数如表 1所示。采用Rd=30的压缩模量计算值作为压缩模量归一化基准E0,绘出归一化压缩模量Ei/E0与径径比Rd关系曲线,如图 8(b)所示,从图可以看出,试验数据点落在模型计算曲线附近,相关系数R2为0.93,综上可见模型具有良好的计算效果。
表 2 尺寸效应模型参数Table 2. Model parameters of size effects名称 a2 b ξ Gs λ β 砂砾石料 2.20 36 6 2.67 — — 堆石料 1.35 64 3 2.67 1.15 0.38 3. 结论
针对堆石筑坝料的尺寸效应问题,将球体变形尺寸效应统一模型推广应用于筑坝料,通过砂砾石料和堆石料侧限压缩试验,研究了压缩模量的尺寸效应变化规律,揭示了破碎率的影响规律,并验证了尺寸效应理论模型,主要得到以下3点结论。
(1)压缩试验中砂砾石的破碎率为0.34%,可按不可破碎材料分析,堆石料的破碎率为2.7%~5.3%,颗粒破碎率越大,堆石料压缩模量越小。
(2)堆石料压缩模量随径径比增加而增加,砂砾石料压缩模量随径径比增加而减小,引起两者规律相反的原因是颗粒破碎的影响。
(3)采用破碎指标λ反映筑坝料的破碎程度,实现了不同类别土石料尺寸效应的统一描述,并能够准确的计算砂砾石料压缩模量随径径比增加而减小、堆石料压缩模量随径径比增加而增加的尺寸效应,且能够计算不同破碎率条件下的尺寸效应,实现了粗粒料尺寸效应模型化预测。
-
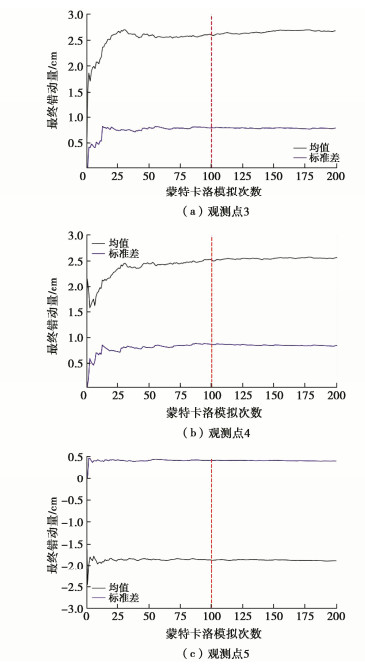
![]()
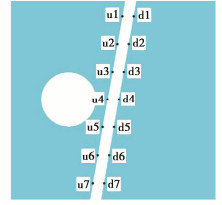
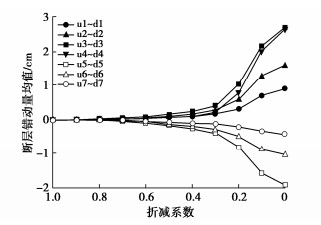
图 9 工况S13各观测点错动量均值
Figure 9. Fault dislocations during excavation process for Case S13
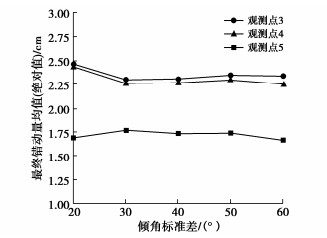
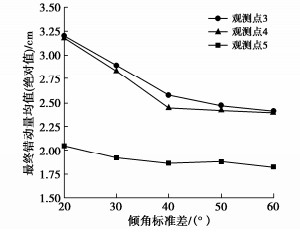
![]()
图 13 错动量均值(绝对值)-倾角标准差
Figure 13. Mean of dislocation (absolute) vs. standard deviation of dip
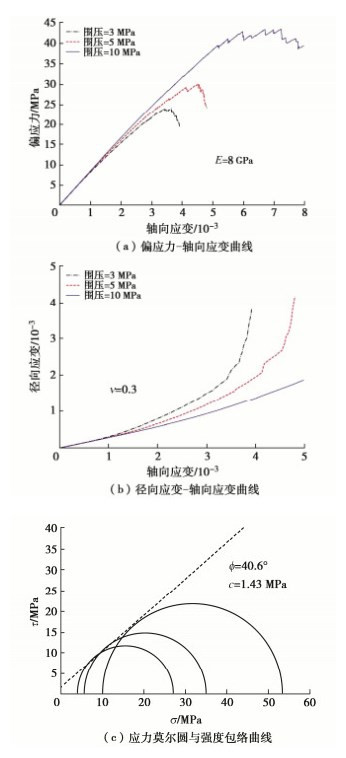
表 1 DP模型参数
Table 1 Parameters of DP model
密度/(kg·m-3) 弹性模量/GPa 泊松比 黏聚力/kPa 内摩擦角/(°) 2200 8 0.3 400 31  下载: 导出CSV
表 2 平行黏结模型参数
Table 2 Parameters of parallel bonded model
线性组 平行黏结组 有效模量/GPa 刚度比 摩擦系数 有效模量/GPa 刚度比 摩擦角/(°) 抗拉强度/MPa 黏结强度/MPa 6.5 3.6 0.577 6.5 3.6 85 12 10
下载: 导出CSV
表 3 光滑节理模型参数及对应的宏观参数
Table 3 Parameters of smooth-joint model and corresponding macroscopic parameters
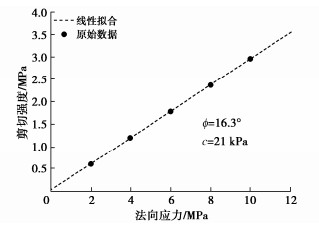
细观参数 宏观参数 法向刚度/GPa 切向刚度/GPa 黏结强度/kPa 抗拉强度/kPa 摩擦因数 黏聚力/kPa 摩擦角/(°) 20 6 4 1 0.3 21 16.3
下载: 导出CSV
表 4 正交设计表
Table 4 Orthogonal design table
编号 μdip/(°) σdip/(°) μlen/m σlen/m FD S1 40 20 4 1 1 S2 40 30 8 7 5 S3 40 40 12 3 4 S4 40 50 6 9 3 S5 40 60 10 5 2 S6 60 20 12 7 3 S7 60 30 6 3 2 S8 60 40 10 9 1 S9 60 50 4 5 5 S10 60 60 8 1 4 S11 80 20 10 3 5 S12 80 30 4 9 4 S13 80 40 8 5 3 S14 80 50 12 1 2 S15 80 60 6 7 1 S16 100 20 8 9 2 S17 100 30 12 5 1 S18 100 40 6 1 5 S19 100 50 10 7 4 S20 100 60 4 3 3 S21 120 20 6 5 4 S22 120 30 10 1 3 S23 120 40 4 7 2 S24 120 50 8 3 1 S25 120 60 12 9 5
下载: 导出CSV
表 5 观测点3错动量均值多因素方差分析结果
Table 5 Results of multivariate analysis of variance of dislocation at monitoring point No. 3
均值 误差平方和 自由度 均方 F检验值 p值 截距 138.255 1 138.225 741.732 0.000** 节理倾角均值 1.688 4 0.422 2.264 0.224 节理倾角标准差 0.082 4 0.021 0.11 0.972 节理长度均值 0.791 4 0.198 1.061 0.478 节理长度标准差 0.705 4 0.176 0.946 0.521 节理密度 15.848 4 3.962 21.26 0.006** 残差 0.745 4 0.186 R2 = 0.962 * p < 0.05 ** p < 0.01
下载: 导出CSV
表 6 观测点4错动量均值多因素方差分析结果
Table 6 Results of multivariate analysis of variance of dislocation at monitoring point No. 4
均值 误差平方和 自由度 均方 F检验值 p值 截距 132.951 1 132.951 621.294 0.000** 节理倾角均值 1.337 4 0.334 1.562 0.338 节理倾角标准差 0.123 4 0.031 0.144 0.956 节理长度均值 0.685 4 0.171 0.801 0.583 节理长度标准差 0.569 4 0.142 0.665 0.649 节理密度 8.978 4 2.245 10.489 0.021* 残差 0.856 4 0.214 R2 = 0.932 * p < 0.05 ** p < 0.01
下载: 导出CSV
表 7 观测点5错动量均值多因素方差分析结果
Table 7 Results of multivariate analysis of variance of dislocation at monitoring point No. 5
均值 误差平方和 自由度 均方 F检验值 p值 截距 74.61 1 74.61 2209.555 0.000** 节理倾角均值 0.511 4 0.128 3.783 0.113 节理倾角标准差 0.035 4 0.009 0.261 0.889 节理长度均值 0.241 4 0.06 1.783 0.295 节理长度标准差 0.207 4 0.052 1.532 0.345 节理密度 2.864 4 0.716 21.206 0.006** 残差 0.135 4 0.034 R2 = 0.966 * p < 0.05 ** p < 0.01
下载: 导出CSV
-
[1] MANOUCHEHRIAN A, CAI M. Analysis of rockburst in tunnels subjected to static and dynamic loads[J]. Journal of Rock Mechanics and Geotechnical Engineering, 2017, 9(6): 1031-1040. doi: 10.1016/j.jrmge.2017.07.001
[2] RINALDI A P, URPi L. Fault reactivation induced by tunneling activity in clay material: hints from numerical modeling[J]. Tunnelling and Underground Space Technology, 2020, 102: 103453. doi: 10.1016/j.tust.2020.103453
[3] MICHAEL R S, THOMAS J. Fault induced rock bursts and micro-tremors: experiences from the Gotthard Base Tunnel[J]. Tunnelling & Underground Space Technology, 2018, 81: 358-366.
[4] ORTLEPP W D, STACEY T R. Rockburst mechanisms in tunnels and shafts[J]. Tunnelling and Underground Space Technology, 1994, 9(1): 59-65. doi: 10.1016/0886-7798(94)90010-8
[5] MANOUCHEHRIAN A, CAI M. Numerical modeling of rockburst near fault zones in deep tunnels[J]. Tunnelling and Underground Space Technology, 2018, 80: 164-180. doi: 10.1016/j.tust.2018.06.015
[6] ZHANG C, FENG X T, ZHOU H, et al. Case histories of four extremely intense rockbursts in deep tunnels[J]. Rock mechanics and rock engineering, 2012, 45: 275-288. doi: 10.1007/s00603-011-0218-6
[7] HUSEN S, KISSLING E, VON Deschwanden A. Induced seismicity during the construction of the Gotthard Base Tunnel, Switzerland: hypocenter locations and source dimensions[J]. Journal of Seismology, 2012, 16(2): 195-213. doi: 10.1007/s10950-011-9261-8
[8] 姜耀东, 王涛, 赵毅鑫, 等. 采动影响下断层活化规律的数值模拟研究[J]. 中国矿业大学学报, 2013, 42(1): 1-5. https://www.cnki.com.cn/Article/CJFDTOTAL-ZGKD201301003.htm JIANG Yaodong, WANG Tao, ZHAO Yixin, et al. Numerical simulation of fault activation pattern induced by coal extraction[J]. Journal of China University of Mining & Technology, 2013, 42(1): 1-5. (in Chinese) https://www.cnki.com.cn/Article/CJFDTOTAL-ZGKD201301003.htm
[9] 张亚民, 马凤山, 王杰, 等. 陡倾断层上下盘开挖引起地表变形的数值模拟分析[J]. 中国地质灾害与防治学报, 2012, 23(3): 61-65. https://www.cnki.com.cn/Article/CJFDTOTAL-ZGDH201203015.htm ZHANG Yamin, MA Fengshan, WANG Jie, et al. Numerical analysis on the ground deformation due to underground excavation in hanging walls and footwalls of steep faults[J]. The Chinese Journal of Geological Hazard and Control, 2012, 23(3): 61-65. (in Chinese) https://www.cnki.com.cn/Article/CJFDTOTAL-ZGDH201203015.htm
[10] 蔡胜海. FLAC3D断层模拟中接触面法与弱化法的研究及应用[D]. 徐州: 中国矿业大学, 2016. CAI Shenghai. Study and Application of the Interface and Weaken Method in FLAC3D Fault Simulation[D]. Xuzhou: China University of Mining and Technology, 2016. (in Chinese)
[11] ZHONG Z L, WANG Z, ZHAO M, et al. Structural damage assessment of mountain tunnels in fault fracture zone subjected to multiple strike-slip fault movement[J]. Tunnelling and Underground Space Technology, 2020(104): 103527.
[12] 禹海涛, 陈志伟. 基于连续-离散耦合方法的隧道开挖对近断层的影响机制研究[J]. 隧道与地下工程灾害防治, 2021(3): 20-28. https://www.cnki.com.cn/Article/CJFDTOTAL-SDZH202103003.htm YU Haitao, CHEN Zhiwei. Influence mechanism of tunnel excavation on adjacent fault based on FDM-DEM coupling method[J]. Hazard Control in Tunnelling and Underground Engineering, 2021(3): 20-28. (in Chinese) https://www.cnki.com.cn/Article/CJFDTOTAL-SDZH202103003.htm
[13] LIN H, SHENG B Y. Failure Characteristics of complicated random jointed rock mass under compressive-shear loading[J]. Geotechnical and Geological Engineering, 2021, 39(5): 3417-3435. doi: 10.1007/s10706-021-01701-6
[14] ZHANG C, LIU X, ZHU G, et al. Distribution patterns of rock mass displacement in deeply buried areas induced by active fault creep slip at engineering scale[J]. Journal of Central South University, 2020, 27(10): 2849-2863. doi: 10.1007/s11771-020-4514-8
[15] 陈欣, 周小涵, 许彬, 等. 裂隙岩体宏细观剪切损伤力学行为研究[J]. 岩石力学与工程学报, 2022, 41(12): 2509-2521. https://www.cnki.com.cn/Article/CJFDTOTAL-YSLX202212011.htm CHEN Xin, ZHOU Xiaohan, XU Bin, et al. Investigation on the macro-meso shear damage mechanical behaviors of fractured rocks[J]. Chinese Journal of Rock Mechanics and Engineering, 2022, 41(12): 2509-2521. (in Chinese) https://www.cnki.com.cn/Article/CJFDTOTAL-YSLX202212011.htm
[16] 杨维忠, 陈胜可, 刘荣. SPSS统计分析从入门到精通[M]. 4版. 北京: 清华大学出版社, 2019. YANG Weizhong, CHEN Shengke, LIU Rong. SPSS Statistical Analysis from Entry to Mastery[M]. 4th ed. Beijing: Tsinghua University Press, 2019. (in Chinese)
-
期刊类型引用(2)
1. 常玉鹏,杨凌云,孟书一,刘广乾. 基于PFC~(3D)软件的砂砾石料缩尺方法对比研究. 水电能源科学. 2025(03): 89-92 .  百度学术
百度学术
2. 白晓宇,刁浩杰,银吉超,桑松魁,张亚妹,张胜凯. 大直径嵌岩灌注桩承载特性试验与有限元模拟. 重庆交通大学学报(自然科学版). 2024(09): 25-33 . 百度学术
其他类型引用(1)
-
其他相关附件


计量
- 文章访问数: 424
- HTML全文浏览量: 48
- PDF下载量: 118
- 被引次数: 3
