
Cyclic threshold shear strains for pore water pressure generation and stiffness degradation in marine clay
-
摘要: 循环阈值剪应变是循环荷载作用下饱和土体的基本特性。针对不同塑性指数(Ip)的长江口原状饱和海洋黏土,开展了一系列应变控制逐级加载的不排水循环三轴试验,研究了引起原状饱和海洋黏土孔压增长的循环阈值剪应变(γtp)和刚度弱化的循环阈值剪应变(γtd)。结果表明:长江口海洋黏土γtp和γtd均随Ip的增大而增大,相同测试条件下,同一海洋黏土的γtp大于γtd,Ip ≈ 17时,γtp = 0.018%~0.019%,γtd = 0.011%~0.012%,Ip ≈ 30时,γtp =0.037%~0.041%,γtd = 0.022%~0.027%;长江口海洋黏土刚度弱化的发生不一定需要孔压的增长,但会因孔压增长而加剧。与已有文献中陆域黏土的γtp和γtd的对比分析发现:特殊的海洋沉积环境是造成长江口海洋黏土γtp和γtd低于原状陆域黏土的原因。Abstract: The cyclic threshold shear strain is a fundamental property of saturated soils under cyclic loading. To investigate the cyclic threshold shear strains for pore water pressure generation (γtp) and stiffness degradation (γtd), a series of strain-controlled multistage undrained cyclic triaxial tests are carried out on the in-situ saturated marine clay in the Yangtze River estuary with different values of plasticity index Ip. The test results show that both γtp and γtd increase with the increasing Ip of the marine clay, and γtp is greater than γtd for the same marine clay tested under the same conditions, with γtp = 0.018% ~ 0.019%, γtd = 0.011% ~ 0.012% for Ip of 17, and γtp = 0.037% ~ 0.041%, γtd = 0.022% ~ 0.027% for Ip of 30. Moreover, the development of stiffness degradation may not necessarily require the pore water pressure generation, but can be aggravated by it. The γtp and γtd of the marine clay are compared with those of the terrestrial soils cited from the published literatures, indicating that the special marine sedimentary environment causes the γtp and γtd of the marine clay in the Yangtze estuary to be smaller than those of the undisturbed terrestrial clay.
-
0. 引言
在我国提出的“提早实现‘碳达峰、碳中和’”这一经济发展的重大战略目标背景下,海上风电平台、钻井平台、海底管线等海洋工程在东南沿海蓬勃发展。我国近海工程地质条件复杂,深厚黏土覆盖层承载力低,在地震、波浪、风暴潮等作用下呈现显著的循环弱化特性,因此,循环荷载作用下海洋黏土的动力特性越发受到重视[1-2]。基于孔压增长循环阈值剪应变(γtp)和刚度弱化循环阈值剪应变(γtd)是海洋岩土工程常遇动态荷载作用下饱和黏土的基本动力特性参数,也是分析解决循环荷载引起的孔压增长和刚度弱化等问题的关键参数。
饱和砂土和陆域黏土的γtp和γtd已被广泛研究[3-12]。但关于原状海洋黏土γtp和γtd的研究尚处在初步探索阶段[13-14],且均是在特定海域和特定条件下开展的,所得结果不完全适用于各海域不同类型的海洋黏土。因此,有必要进一步开展原状海洋黏土γtd和γtp的研究。
本文针对我国长江口原状海洋黏土,开展了一系列分级加载应变控制式的不排水循环三轴试验,研究了原状饱和海洋黏土的孔压增长的循环阈值剪应变$ {\gamma _{{{\text{tp}}}}} $和刚度弱化的循环阈值剪应变$ {\gamma _{{{\text{td}}}}} $,揭示了不同塑性指数的原状饱和海洋黏土$ {\gamma _{{{\text{tp}}}}} $和$ {\gamma _{{{\text{td}}}}} $的变化规律与两者间的联系,有助于进一步理解和分析海洋黏土的动力特性问题。
1. 试样及试验方法
1.1 海洋原状土取样与物理性质指标
试验所用海洋土取自长江入海口近海域,场区中心离岸距离约37 km。通过敞口薄壁取土器提取钻孔J7自海床以下3~29 m深度范围内原状海洋土,根据《土的工程分类标准(GB/T 50145—2007)》[15],试验所用海洋土为黏土,其基本物理指标如表 1所示。
表 1 海洋黏土基本物理指标及试验工况Table 1. Basic physical properties and experimental conditions of marine clay试样
编号基本物理指标 试验条件 海床以下
深度/mGs 含水率/
%天然密度/
(g·cm-3)塑性指数
Ip土类
名称初始有效固结
压力$ {\sigma '_{{{\text{c}}}0}} $/kPaγc/
%固结后
体变/%J7-4 7.6~7.8 2.66 42.22 1.78 30.6 黏土 55 0.015, 0.03,
0.075, 0.15,
0.75, 1, 33.81 J7-6 9.6~9.8 2.64 47.23 1.75 32.8 黏土 70 4.64 J7-8 11.6~11.8 2.55 45.61 1.59 17.4 黏土 80 5.31 J7-10 14.6~14.8 2.65 43.64 1.77 34.5 黏土 100 3.43 J7-14 18.6~18.8 2.63 42.21 1.74 31.9 黏土 130 4.94 J7-24 28.6~28.8 2.65 35.35 1.93 17.2 黏土 200 5.56 1.2 应变控制逐级加载的不排水循环三轴试验
应变控制逐级加载的不排水循环三轴试验通过英国GDS循环三轴仪实现,该设备的功能指标详见文献[16]。对试样施加循环剪应变幅值$ {\gamma _{{\text{c}}}} $由小到大的7级正弦波荷载,加载频率为0.1 Hz,每级循环振次N为10。具体试验工况见表 1。循环三轴试验可测试加载过程中试样的轴向应力$ {\sigma _{{\text{d}}}} $和轴向应变$\varepsilon $。根据弹性理论,加载过程中试样45°面的剪应力$\tau $和剪应变γ可按下式计算[17-18]:
$$ \begin{equation} \left\{\begin{array}{l} \tau=\sigma_{\mathrm{d}} / 2 \\ \gamma=(1+v) \varepsilon \end{array}\right., \end{equation} $$ (1) 式中,$ \nu $为泊松比,不排水循环加载过程中饱和海洋黏土不产生体应变,可取$ \nu $= 0.5[19]。
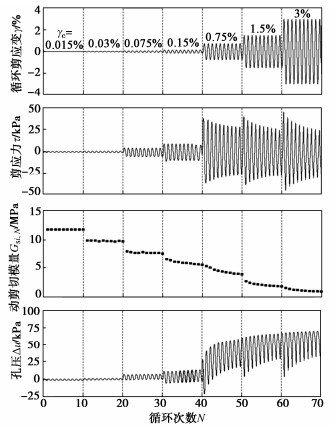
图 1给出了代表性试样J7-10(Ip = 34.5)应变、应力、动剪切模量和孔压随N的变化曲线。可以看出,试样孔压Δu在第1级循环加载中不随N的增大而增长,在第2级中是否有增长无法直观发现,而在第3~7级中发生了显著增长。因此,海洋黏土存在基于孔压增长循环阈值剪应变$ {\gamma _{{{\text{tp}}}}} $:在$ {\gamma _{{\text{c}}}} $ < $ {\gamma _{{{\text{tp}}}}} $时,孔压不会随N的增大而增长;在$ {\gamma _{{\text{c}}}} $ > $ {\gamma _{{{\text{tp}}}}} $时,孔压会随N的增大而逐渐增长。J7-10的$ {\gamma _{{{\text{tp}}}}} $应介于0.015%~0.075%之间。还可发现,第i阶段第N次循环试样的动剪切模量$ {G_{{{\text{s}}}i, N}} $在第1级循环加载中保持不变,但在之后6个阶段中随N的增大而逐渐降低,这反映了土的刚度弱化特性。因此,海洋黏土存在刚度弱化循环阈值剪应变$ {\gamma _{{{\text{td}}}}} $:当$ {\gamma _{{\text{c}}}} $ < $ {\gamma _{{{\text{td}}}}} $时,土体不发生刚度弱化,此阶段土体的微观结构几乎不发生变化;在$ {\gamma _{{\text{c}}}} $ > $ {\gamma _{{{\text{td}}}}} $时,微观结构遭到破坏,土体发生刚度弱化。可初步确定J7-10的$ {\gamma _{{{\text{td}}}}} $应小于0.75%。如何准确确定海洋黏土$ {\gamma _{{{\text{tp}}}}} $和$ {\gamma _{{{\text{td}}}}} $的值将在下节进行详细讨论。
![]() 图 1 J7-10应变、应力、动剪切模量和孔压随循环振次的变化Figure 1. Variation of strain, stress, dynamic shear modulus and pore pressure with cycles for J7-10
图 1 J7-10应变、应力、动剪切模量和孔压随循环振次的变化Figure 1. Variation of strain, stress, dynamic shear modulus and pore pressure with cycles for J7-102. 试验结果与分析
2.1 孔压增长循环阈值剪应变$ {\gamma _{{{\text{tp}}}}} $
为准确确定长江口海洋黏土的$ {\gamma _{{{\text{tp}}}}} $,将每级循环加载作为一个独立加载阶段,第i阶段试样的有效应力${\sigma '_{{{\text{c}}}i}}$和第i阶段第N次循环试样的修正残余孔压$\Delta {u_{i, N}}^ * $分别由式(3)和式(4)计算:
$$ {{\sigma }^{\prime }}_{{\text{c}}i}={{\sigma }^{\prime }}_{{\text{c}}0}-\Delta {u}_{i-1}{\text{,}}{\text{ }}(i=1, 2, \cdots , 7) {\text{,}} $$ (2) $$ \Delta {u}_{i, N}{}^{\ast }=\Delta {u}_{i, N}-\Delta {u}_{i-1}{\text{,}}{\text{ }}(i=1, 2, \cdots , 7) {\text{,}} $$ (3) 式中:$\Delta {u_{i - 1}}$为第i-1阶段试样的残余孔压,其中$\Delta {u_0}{{\text{ = }}}0$;$\Delta {u_{i, N}}$为第i阶段第N次循环试样的实测残余孔压。随后,每个阶段中第N次循环的归一化残余孔压比$ r{_{{{\text{u}}}i, N}{}^{\ast } } $可通过式(5)确定:
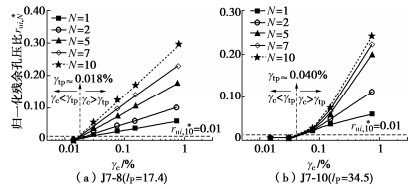
$$ {r}_{{\text{u}}i, N}{}^{\ast }=\Delta {u}_{i, N}{}^{\ast }/{{\sigma }^{\prime }}_{{\text{c}}i}{\text{,}}{\text{ }}(i=1, 2, \cdots , 7) 。 $$ (4) 图 2为代表性试样J7-8和J7-10的$ r{_{{{\text{u}}}i, N}{}^{\ast }} $与$ {\gamma _{{\text{c}}}} $的关系曲线,可以发现,在本试验所施加的$ {\gamma _{{\text{c}}}} $范围内,J7-8(Ip ≈ 17)与J7-10(Ip ≈ 30)的孔压发展存在显著区别,其中,J7-8的孔压随$ {\gamma _{{\text{c}}}} $的增大而线性增大,而J7-10的孔压在γc < 0.15%时增长缓慢,在$ {\gamma _{{\text{c}}}} $ > 0.15%时开始大幅度增长。相同$ {\gamma _{{\text{c}}}} $和N条件下,Ip ≈ 17试样的残余孔压大于Ip ≈ 30试样,即具有较小Ip的海洋黏土的孔压发展速率大于具有较大Ip的海洋黏土。
![]() 图 2 代表性试样J7-8和J7-10的$ r{_{{{\text{u}}}i, N}{}^{\ast }} $与$ {\gamma _{{\text{c}}}} $的关系曲线Figure 2. Relation curves between $ r{_{{{\text{u}}}i, N}{}^{\ast } } $ and $ {\gamma _{{\text{c}}}} $ for J7-8 and J7-10
图 2 代表性试样J7-8和J7-10的$ r{_{{{\text{u}}}i, N}{}^{\ast }} $与$ {\gamma _{{\text{c}}}} $的关系曲线Figure 2. Relation curves between $ r{_{{{\text{u}}}i, N}{}^{\ast } } $ and $ {\gamma _{{\text{c}}}} $ for J7-8 and J7-10以第i阶段第10次循环后试样的归一化残余孔压比$ r{_{{{\text{u}}}i, 10}{}^{\ast }} $首次达到0.01,即残余孔压首次达到有效围压的1%时的循环剪应变幅值作为$ {\gamma _{{{\text{tp}}}}} $,此时孔压发生明显的增长,图 3中的蓝色虚线表示$ r{_{{{\text{u}}}i, 10}{}^{\ast } } $ = 0.01。J7-8的$ r{_{{{\text{u}}}i, N}{}^{\ast }} $在循环加载的第1个阶段始终保持为0,在第2个阶段有明显的增长,根据$ r{_{{{\text{u}}}i, 10}{}^{\ast } } $的发展趋势可确定J7-8的$ {\gamma _{{{\text{tp}}}}} $约为0.018%。J7-10的$ r{_{{{\text{u}}}i, N}{}^{\ast }} $在前2个阶段始终为0,而在之后的几个阶段出现明显的增长。类似地,根据$ r{_{{{\text{u}}}i, 10}{}^{\ast } } $的发展趋势可确定试样的$ {\gamma _{{{\text{tp}}}}} $,结果汇总于表 2,可以发现海洋黏土的$ {\gamma _{{{\text{tp}}}}} $随着Ip的增大而增大。
![]() 图 3 代表性试样J7-8和J7-10的δ与N的关系曲线Figure 3. Relation curves between δ and N for J7-8 and J7-10表 2 海洋黏土γtp和γtd汇总表Table 2. Summary table of γtp and γtd of marine clay
图 3 代表性试样J7-8和J7-10的δ与N的关系曲线Figure 3. Relation curves between δ and N for J7-8 and J7-10表 2 海洋黏土γtp和γtd汇总表Table 2. Summary table of γtp and γtd of marine clay试样编号 塑性指数Ip γtp /% γtd /% γtp/γtd J7-8 17.4 0.018 0.011 1.64 J7-24 17.2 0.019 0.012 1.58 J7-10 34.5 0.040 0.027 1.48 J7-6 32.8 0.039 0.026 1.50 J7-14 31.9 0.037 0.023 1.61 J7-4 30.6 0.041 0.022 1.86 2.2 刚度弱化循环阈值剪应变$ {\gamma _{{{\text{td}}}}} $
循环荷载作用下土体的刚度弱化特性可用弱化指数δ和弱化参数t量化表征[20],δ和t分别反映土体刚度弱化的程度和速度。应变控制的试验中δ和t表达式分别为:
$$ \delta = \frac{{{G_{{{\text{s}}}i, N}}}}{{{G_{i, }}_1}} = \frac{{{\tau _{{{\text{c}}}i, N}}/{\gamma _{{{\text{c}}}i}}}}{{{\tau _{{{\text{c}}}i, 1}}/{\gamma _{{{\text{c}}}i}}}} = \frac{{{\tau _{{{\text{c}}}i, N}}}}{{{\tau _{{{\text{c}}}i, 1}}}} {\text{,}} $$ (5) $$ t=-\frac{\mathrm{log}\delta }{\mathrm{log}N}{\text{ }}或{\text{ }}\delta {\text{ = }}{N}^{-t} 。 $$ (6) 式中:$ {G_{i, }}_1 $为第i阶段第1次循环试样的动剪切模量;$ {\tau _{{{\text{c}}}i, 1}} $第i阶段第1次循环试样的剪应力幅值。
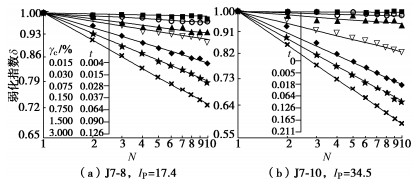
图 3为代表性试样J7-8和J7-10的δ与N的关系曲线,可以看出,$ {\gamma _{{\text{c}}}} $不发生变化时,双对数坐标系下δ随N的增大而线性减小,即t始终保持恒定,表明一旦土体发生了刚度弱化,即使其双幅剪应变不再发展,土体的刚度弱化程度依然会增大。土体发生刚度弱化后,随着$ {\gamma _{{\text{c}}}} $的继续增大,相同循环振次下,试样δ和t明显增大,表明土体刚度弱化程度和弱化速度会随变形的增大而加剧。
J7-8(Ip ≈ 17)在循环加载的第1个阶段就发生了刚度弱化,因此,其$ {\gamma _{{{\text{td}}}}} $应小于0.015%;J7-10(Ip ≈ 30)在循环加载的第1个阶段未发生了刚度弱化,而在之后的6个阶段均出现了不同程度的刚度弱化,因此,其$ {\gamma _{{{\text{tp}}}}} $介于0.015%~0.030%之间。
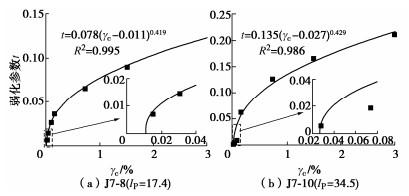
弱化参数t与$ {\gamma _{{\text{c}}}} $的关系可用下式来进行拟合:
$$ t = a \cdot {({\gamma _{{\text{c}}}} - {\gamma _{{{\text{td}}}}})^b} {\text{,}} $$ (7) 式中,a和b为拟合参数。t与$ {\gamma _{{\text{c}}}} $的拟合结果如图 4所示。可以发现,J7-8的$ {\gamma _{{{\text{td}}}}} $约为0.011%,J7-10的$ {\gamma _{{{\text{td}}}}} $约为0.027%,结果汇总于表 2,海洋黏土$ {\gamma _{{{\text{td}}}}} $随着Ip的增大而增大,而Ip比较相近时,试样的$ {\gamma _{{{\text{td}}}}} $也相差不大。
![]() 图 4 代表性试样J7-8和J7-10的t与γc的关系曲线Figure 4. Relation curves between t and γc for J7-8 and J7-10
图 4 代表性试样J7-8和J7-10的t与γc的关系曲线Figure 4. Relation curves between t and γc for J7-8 and J7-102.3 长江口海洋黏土$ {\gamma _{{{\text{tp}}}}} $与$ {\gamma _{{{\text{td}}}}} $间的差异与分析
从表 2可以发现,长江口海洋黏土的$ {\gamma _{{{\text{tp}}}}} $与$ {\gamma _{{{\text{td}}}}} $存在明显差异,同一海洋黏土$ {\gamma _{{{\text{tp}}}}} $总是大于$ {\gamma _{{{\text{td}}}}} $,最小相差1.48倍(J7-10),最大相差1.86倍(J7-4)。由上述结果可发现:当$ {\gamma _{{\text{c}}}} $ < $ {\gamma _{{{\text{td}}}}} $时,土体既不发生孔压增长,也不发生刚度弱化;当$ {\gamma _{{\text{c}}}} $介于$ {\gamma _{{{\text{td}}}}} $~$ {\gamma _{{{\text{tp}}}}} $之间时,土体不发生孔压增长,有效应力不变,却发生一定程度的刚度弱化;当$ {\gamma _{{\text{c}}}} $ > $ {\gamma _{{{\text{tp}}}}} $时,孔压开始增长,刚度弱化程度随之大幅度提高。故可初步认为,由循环荷载作用输入的动能会导致海洋黏土微观结构的逐渐破坏,并引发土体的刚度弱化,当能量超过其初始结构所能承受的范围时,部分动能转化为孔隙水势能,随后孔压开始增长,加剧土体的刚度弱化。综上,海洋黏土刚度弱化的发展不一定需要孔压增长,但孔压的增长会进一步破坏土体结构,使土体刚度发生更严重的弱化。
2.4 海洋黏土和陆域黏土循环阈值剪应变差异分析
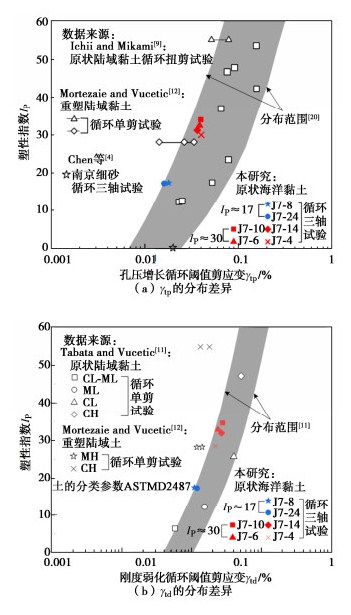
图 5对比了长江口海洋黏土$ {\gamma _{{{\text{tp}}}}} $和$ {\gamma _{{{\text{td}}}}} $与文献[4,9,11,12,20,21]所述各类土的分布差异,图 5(a),(b)中灰色区域分别为Vucetic[21]、Tabata和Vucetic[11]提出的各类土$ {\gamma _{{{\text{tp}}}}} $、$ {\gamma _{{{\text{td}}}}} $的分布范围。可以发现,各类土$ {\gamma _{{{\text{tp}}}}} $和$ {\gamma _{{{\text{td}}}}} $均随Ip的增大而总体呈增大趋势。原状陆域黏土的$ {\gamma _{{{\text{tp}}}}} $和$ {\gamma _{{{\text{td}}}}} $多分布于灰色区域的中部及右侧,而重塑陆域黏土的$ {\gamma _{{{\text{tp}}}}} $分布于灰色区域左侧和左边界线的左侧,$ {\gamma _{{{\text{td}}}}} $分布于左边界线的左侧。这是因为重塑破坏了原状土的微观结构,使得重塑土的结构性较弱,循环荷载作用下重塑土比原状土更容易发生破坏。
![]()
长江口海洋黏土的$ {\gamma _{{{\text{tp}}}}} $和$ {\gamma _{{{\text{td}}}}} $均基本沿着左边界线分布,其中Ip ≈ 17的海洋黏土表现得更为明显,这与陆域黏土存在显著区别。这是因为海洋黏土的沉积环境特殊,在高含盐量、低温的海水环境和特殊胶结物质的影响下,海洋黏土形成了高孔隙的骨架结构,具有高含水率、高压缩性、低渗透性等物理特性。此外,在长江入海口水流的作用下,长江口海洋黏土快速沉积,黏土矿物之间结构无法及时调整到最稳定的位置,颗粒间的连结比较脆弱,导致粒间胶结强度低,受外荷载的作用更容易破坏。沉积环境与物理特性间的差异导致了长江口海洋黏土与原状陆域黏土甚至其他海域黏土的力学性质存在着较大差异。
3. 结论
本文对长江入海口原状海洋黏土开展了应变控制分级加载的不排水循环三轴试验,研究了原状海洋黏土孔压增长循环阈值剪应变$ {\gamma _{{{\text{tp}}}}} $和刚度弱化循环阈值剪应变$ {\gamma _{{{\text{td}}}}} $,得到的结论如下:
(1)长江口海洋黏土$ {\gamma _{{{\text{tp}}}}} $和$ {\gamma _{{{\text{td}}}}} $随着塑性指数Ip的增大而增大。Ip ≈ 17时,$ {\gamma _{{{\text{tp}}}}} $ = 0.018%~0.019%,$ {\gamma _{{{\text{td}}}}} $= 0.011%~0.012%;Ip ≈ 30时,$ {\gamma _{{{\text{tp}}}}} $ =0.037%~0.041%,$ {\gamma _{{{\text{td}}}}} $ = 0.022%~0.027%。相同测试条件下,同一海洋黏土的$ {\gamma _{{{\text{tp}}}}} $大于$ {\gamma _{{{\text{td}}}}} $,$ {\gamma _{{{\text{tp}}}}} $/$ {\gamma _{{{\text{td}}}}} $介于1.48~1.86之间。
(2)循环荷载作用下,海洋黏土发生刚度弱化和孔压增长有先后顺序,刚度弱化的发展先于孔压的增长。土体刚度弱化的发展不一定需要孔压增长,但孔压增长会加剧土体刚度弱化。
(3)与已有文献数据对比分析发现,长江口海洋黏土$ {\gamma _{{{\text{tp}}}}} $和$ {\gamma _{{{\text{td}}}}} $小于原状陆域黏土,这是因为长江口海洋黏土受特殊的海洋沉积环境影响而具有较低的颗粒间胶结强度,使其在循环荷载作用下更易破坏。重塑陆域黏土因结构性差,其$ {\gamma _{{{\text{tp}}}}} $和$ {\gamma _{{{\text{td}}}}} $也低于原状陆域黏土。
-
![]()
图 1 J7-10应变、应力、动剪切模量和孔压随循环振次的变化
Figure 1. Variation of strain, stress, dynamic shear modulus and pore pressure with cycles for J7-10
![]()
图 2 代表性试样J7-8和J7-10的rui,N∗与γc的关系曲线
Figure 2. Relation curves between rui,N∗ and γc for J7-8 and J7-10
![]()
图 3 代表性试样J7-8和J7-10的δ与N的关系曲线
Figure 3. Relation curves between δ and N for J7-8 and J7-10
![]()
图 4 代表性试样J7-8和J7-10的t与γc的关系曲线
Figure 4. Relation curves between t and γc for J7-8 and J7-10
![]()
表 1 海洋黏土基本物理指标及试验工况
Table 1 Basic physical properties and experimental conditions of marine clay
试样
编号基本物理指标 试验条件 海床以下
深度/mGs 含水率/
%天然密度/
(g·cm-3)塑性指数
Ip土类
名称初始有效固结
压力σ′c0/kPaγc/
%固结后
体变/%J7-4 7.6~7.8 2.66 42.22 1.78 30.6 黏土 55 0.015, 0.03,
0.075, 0.15,
0.75, 1, 33.81 J7-6 9.6~9.8 2.64 47.23 1.75 32.8 黏土 70 4.64 J7-8 11.6~11.8 2.55 45.61 1.59 17.4 黏土 80 5.31 J7-10 14.6~14.8 2.65 43.64 1.77 34.5 黏土 100 3.43 J7-14 18.6~18.8 2.63 42.21 1.74 31.9 黏土 130 4.94 J7-24 28.6~28.8 2.65 35.35 1.93 17.2 黏土 200 5.56  下载: 导出CSV
表 2 海洋黏土γtp和γtd汇总表
Table 2 Summary table of γtp and γtd of marine clay
试样编号 塑性指数Ip γtp /% γtd /% γtp/γtd J7-8 17.4 0.018 0.011 1.64 J7-24 17.2 0.019 0.012 1.58 J7-10 34.5 0.040 0.027 1.48 J7-6 32.8 0.039 0.026 1.50 J7-14 31.9 0.037 0.023 1.61 J7-4 30.6 0.041 0.022 1.86
下载: 导出CSV
-
[1] ZHU J F, ZHAO H Y, LUO Z Y, et al. Investigation of the mechanical behavior of soft clay under combined shield construction and ocean waves[J]. Ocean Engineering, 2020, 206: 107250. doi: 10.1016/j.oceaneng.2020.107250
[2] 黄茂松, 边学成, 陈育民, 等. 土动力学与岩土地震工程[J]. 土木工程学报, 2020, 53(8): 64-86. https://www.cnki.com.cn/Article/CJFDTOTAL-TMGC202008008.htm HUANG Maosong, BIAN Xuecheng, CHEN Yumin, et al. Soil dynamics and geotechnical earthquake engineering[J]. China Civil Engineering Journal, 2020, 53(8): 64-86. (in Chinese) https://www.cnki.com.cn/Article/CJFDTOTAL-TMGC202008008.htm
[3] 潘华, 陈国兴. 复杂应力条件下饱和南京细砂门槛剪应变特性[J]. 南京工业大学学报(自然科学版), 2011, 33(3): 28-32. doi: 10.3969/j.issn.1671-7627.2011.03.006 PAN Hua, CHEN Guoxing. Characteristics of threshold shear strain of saturated Nanjing fine sand under complex stress condition[J]. Journal of Nanjing University of Technology (Natural Science Edition), 2011, 33(3): 28-32. (in Chinese) doi: 10.3969/j.issn.1671-7627.2011.03.006
[4] CHEN G X, ZHAO D F, CHEN W Y, et al. Excess pore-water pressure generation in cyclic undrained testing[J]. Journal of Geotechnical and Geoenvironmental Engineering, 2019, 145(7): 04019022. doi: 10.1061/(ASCE)GT.1943-5606.0002057
[5] VUCETIC M, THANGAVEL H, MORTEZAIE A. Cyclic secant shear modulus and pore water pressure change in sands at small cyclic strains[J]. Journal of Geotechnical and Geoenvironmental Engineering, 2021, 147(5): 04021018. doi: 10.1061/(ASCE)GT.1943-5606.0002490
[6] SAATHOFF J E, ACHMUS A. Excess pore pressure estimation based on cyclic laboratory tests[C]//Proceedings of the 7th International Young Geotechnical Engineers Conference, Australian Geomechanics Society. Sydney Australia, 2022: 451-456.
[7] ANDREASSON B A. Dynamic deformation characteristics of a soft clay[C]//5th International Conference on Recent Advances in Geotechnical Earthquake Engineering and Soil Dynamics. St Louis, Missouri, 1981: 65-70.
[8] OHARA S, MATSUDA H. Study on the settlement of saturated clay layer induced by cyclic shear[J]. Soils and Foundations, 1988, 28(3): 103-113. doi: 10.3208/sandf1972.28.3_103
[9] ICHII K, MIKAMI T. Cyclic threshold shear strain in pore water pressure generation in clay in situ samples[J]. Soils and Foundations, 2018, 58(3): 756-765. doi: 10.1016/j.sandf.2018.01.005
[10] HSU C C, VUCETIC M. Threshold shear strain for cyclic pore-water pressure in cohesive soils[J]. Journal of Geotechnical and Geoenvironmental Engineering, 2006, 132(10): 1325-1335. doi: 10.1061/(ASCE)1090-0241(2006)132:10(1325)
[11] TABATA K, VUCETIC M. Threshold shear strain for cyclic degradation of three clays[C]//5th International Conference on Recent Advances in Geotechnical Earthquake Engineering and Soil Dynamics. San Diego, California, 2010, session01a: 30.
[12] MORTEZAIE A, VUCETIC M. Threshold shear strains for cyclic degradation and cyclic pore water pressure generation in two clays[J]. Journal of Geotechnical and Geoenvironmental Engineering, 2016, 142(5): 04016007. doi: 10.1061/(ASCE)GT.1943-5606.0001461
[13] BANERJEE S, BALAJI P. Effect of anisotropy on cyclic properties of Chennai marine clay[J]. International Journal of Geosynthetics and Ground Engineering, 2018, 4(3): 1-11.
[14] ABDELLAZIZ M, KARRAY M, CHEKIRED M, et al. Shear modulus and hysteretic damping ratio of sensitive eastern Canada clays[J]. Canadian Geotechnical Journal, 2021, 58(8): 1118-1134. doi: 10.1139/cgj-2020-0254
[15] 中华人民共和国建设部. 土的工程分类标准: GB/T 50145—2007[S]. 北京: 中国计划出版社, 2008. Ministry of Construction of the People's Republic of China. Standard for Engineering Classification of Soil: GB/T 50145—2007[S]. Beijing: China Planning Press, 2008. (in Chinese)
[16] 马维嘉, 陈国兴, 李磊, 等. 循环荷载下饱和南沙珊瑚砂的液化特性试验研究[J]. 岩土工程学报, 2019, 41(5): 981-988. doi: 10.11779/CJGE201905023 MA Weijia, CHEN Guoxing, LI Lei, et al. Experimental study on liquefaction characteristics of saturated coral sand in Nansha Islands under cyclic loading[J]. Chinese Journal of Geotechnical Engineering, 2019, 41(5): 981-988. (in Chinese) doi: 10.11779/CJGE201905023
[17] ROLLINS K M, EVANS M D, DIEHL N B, et al. Shear modulus and damping relationships for gravels[J]. Journal of Geotechnical and Geoenvironmental Engineering, 1998, 124(5): 396-405. doi: 10.1061/(ASCE)1090-0241(1998)124:5(396)
[18] CHEN G X, ZHOU Z L, SUN T A, et al. Shear modulus and damping ratio of sand-gravel mixtures over a wide strain range[J]. Journal of Earthquake Engineering, 2019, 23(8): 1407-1440. doi: 10.1080/13632469.2017.1387200
[19] 栾茂田, 何杨, 许成顺, 等. 黄河三角洲粉土循环剪切特性的试验研究[J]. 岩土力学, 2008, 29(12): 3211-3216. https://www.cnki.com.cn/Article/CJFDTOTAL-YTLX200812011.htm LUAN Maotian, HE Yang, XUN Chengshun, et al. Experimental study of cyclic shear behaviour of silty soils in Yellow River Delta[J]. Rock and Soil Mechanics, 2008, 29(12): 3211-3216. (in Chinese) https://www.cnki.com.cn/Article/CJFDTOTAL-YTLX200812011.htm
[20] HSU C C, VUCETIC M. Volumetric threshold shear strain for cyclic settlement[J]. Journal of Geotechnical and Geoenvironmental Engineering, 2004, 130(1): 58-70. doi: 10.1061/(ASCE)1090-0241(2004)130:1(58)
[21] VUCETIC M. Cyclic threshold shear strains in soils[J]. Journal of Geotechnical Engineering, 1994, 120(12): 2208-2228.
计量
- 文章访问数: 166
- HTML全文浏览量: 36
- PDF下载量: 41
