 Download:
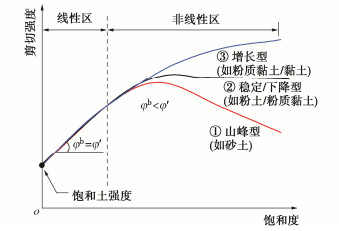
Brittle and plastic failure characteristics
Figures of the Article
-
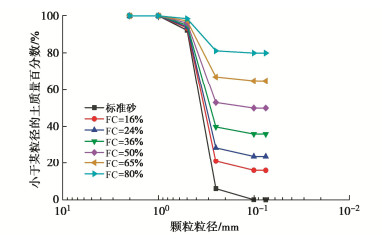
![]() Grain-size distribution curves of test soils
Grain-size distribution curves of test soils
-
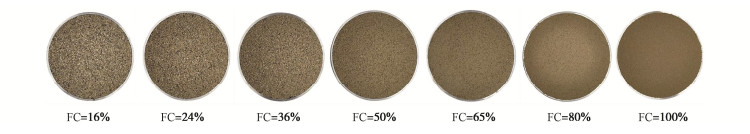
![]() Photos of coarse-fine mixed soils with different FCs
Photos of coarse-fine mixed soils with different FCs
-
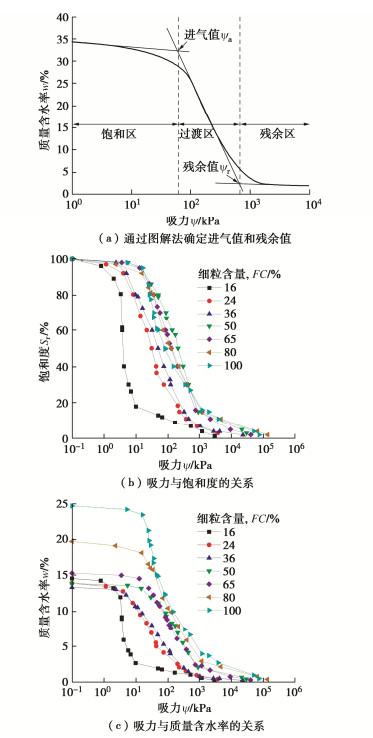
![]() Soil-water characteristic curves
Soil-water characteristic curves
-
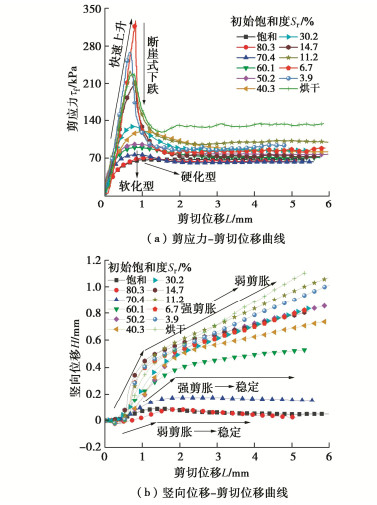
![]() Results from direct shear tests on coarse-fine mixed soils (FC=36%, σv=100 kPa)
Results from direct shear tests on coarse-fine mixed soils (FC=36%, σv=100 kPa)
-
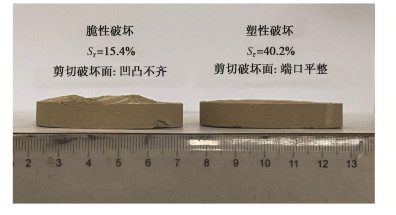
![]() Brittle failure of unsaturated soils with low degree of saturation (FC=100%)
Brittle failure of unsaturated soils with low degree of saturation (FC=100%)
-
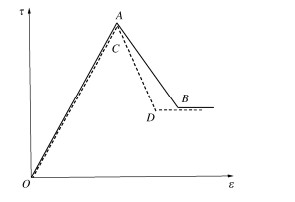
![]() Sketch for limitation of brittleness index IB[20]
Sketch for limitation of brittleness index IB[20]
-
![]() Variation of law of brittleness index with degree of saturation
Variation of law of brittleness index with degree of saturation
-
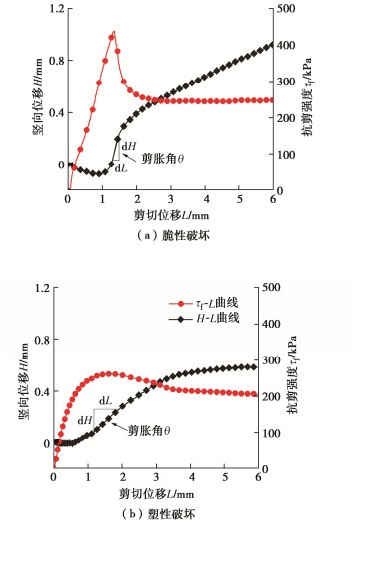
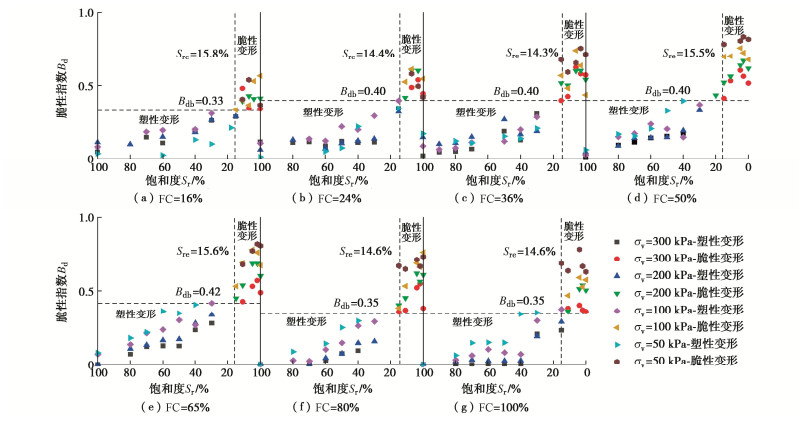
![]() Brittle and plastic failure characteristics
Brittle and plastic failure characteristics
-
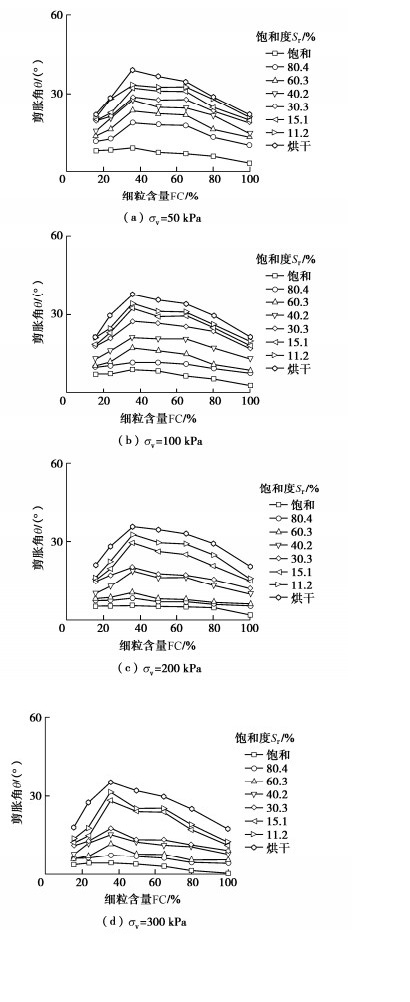
![]() Dilation angles of coarse-fine mixed soils
Dilation angles of coarse-fine mixed soils
-
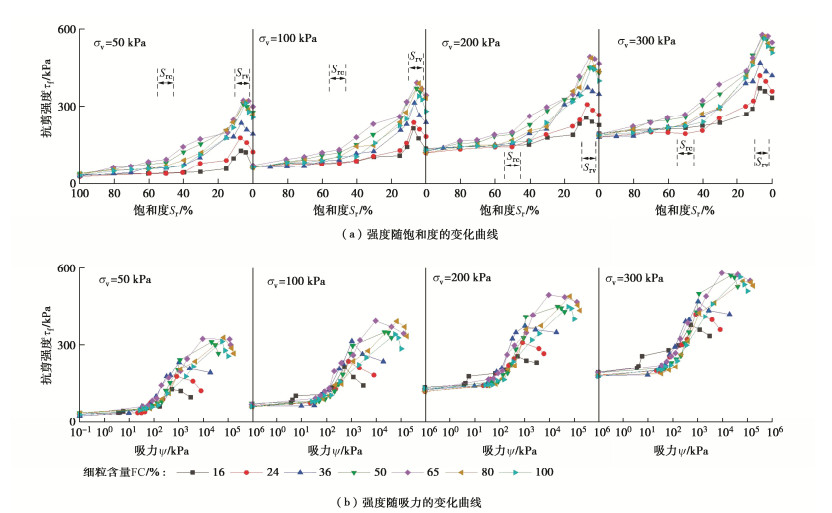
![]() Variation of unsaturated strength with degree of saturation and suction
Variation of unsaturated strength with degree of saturation and suction
-
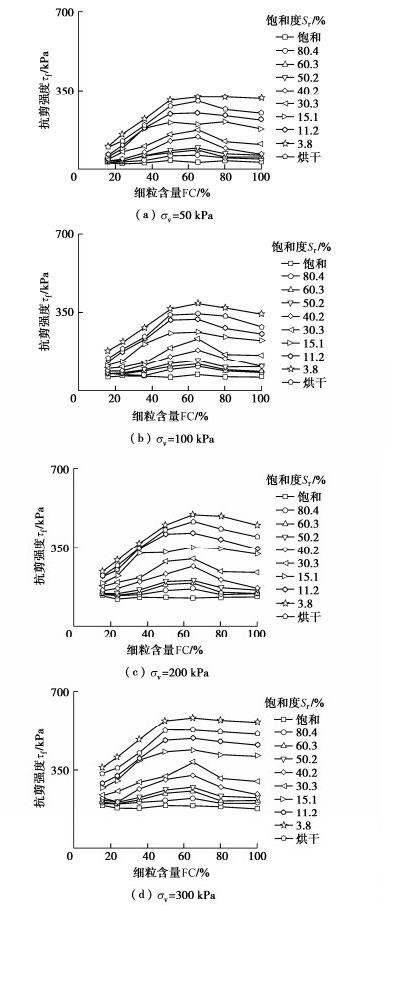
![]() Comparison of shear strengths of coarse-fine mixed soils
Comparison of shear strengths of coarse-fine mixed soils
-
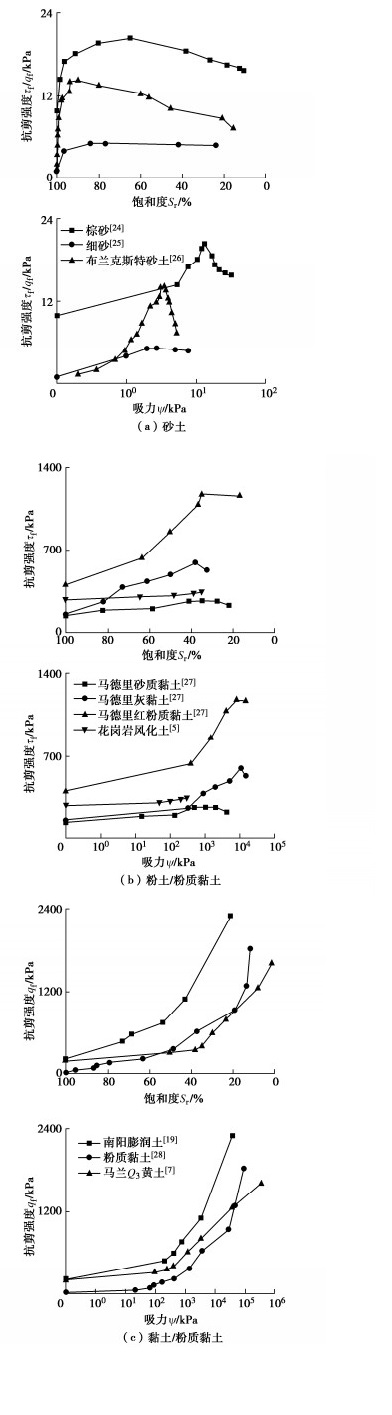
![]() Variation of shear strength of different types of soils with saturation and suction
Variation of shear strength of different types of soils with saturation and suction
-
![]() Types of shear strength for unsaturated soils[30]
Types of shear strength for unsaturated soils[30]
Tables of the Article
-
Dry densities and water contents of test soils
FC/% 16 24 36 50 65 80 100 ρd/(g·cm-3) 1.89 1.94 2.04 2.00 1.94 1.81 1.68 wopt/% 6.7 7.5 8.8 10.3 11.8 13.4 15.5 -
Main parameters of soil-water characteristic curves
FC/% ψa/kPa ψr/kPa Sre/% 16 2.5 9.0 15.8 24 6.2 98.6 14.4 36 8.5 450.0 14.3 50 16.0 700.0 15.5 65 16.6 750.0 15.6 80 20.0 1000.0 14.6 100 25.0 1300.0 14.6 注:ψa为进气值,ψr为残余值,Sre为残余饱和度。
Related articles
-
2021, 43(10): 1887-1895. DOI: 10.11779/CJGE202110015
-
2020, 42(7): 1211-1219. DOI: 10.11779/CJGE202007004
-
2020, 42(5): 908-915. DOI: 10.11779/CJGE202005013
-
2015, 37(2): 363-368. DOI: 10.11779/CJGE201502022
-
2010, 32(5)
-
2002, 24(2): 183-187.
-
2001, 23(4): 412-417.
-
2001, 23(4): 393-396.
-
2000, 22(1): 64-68.
-
1991, 13(1): 24-33.
