Experimental study on size effect of shear strength of joints with different infill ratios
-
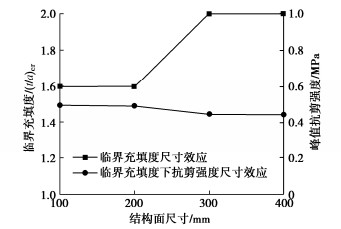
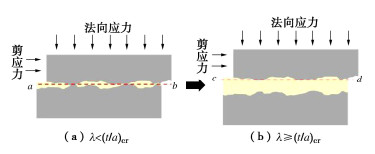
摘要: 针对现有岩体结构面抗剪强度尺寸效应研究较少考虑充填程度差异影响的不足,首先基于渐进扩大法选取平均起伏差和平均起伏角相近的4种连续尺寸天然结构面形貌,并通过3D打印技术制作结构面面板,然后结合类岩石材料配制方法和毫米级充填装置制备5种充填度的充填结构面,最后通过课题组自主研发的大型结构面直剪试验系统开展3种法向应力条件下的室内直剪试验,获得充填结构面的剪切力学与破坏特征,并分析临界充填度和抗剪强度尺寸效应特性。结果表明:随着充填度的增加,结构面剪切破坏模式主要由“岩-岩”剪断破坏逐渐转变为“岩-土界面”滑动破坏,且结构面归一化峰值抗剪强度逐渐减小,直至达到临界充填度时趋于稳定;随着结构面尺寸的增加,临界充填度逐渐增加,变化范围为1.6~2.0;无充填结构面抗剪强度存在较明显的正尺寸效应,而充填结构面抗剪强度尺寸效应较不明显。通过尺寸效应机理分析发现,在不考虑结构面平均起伏角的影响下,平均起伏高度是影响临界充填度和抗剪强度尺寸效应的主要因素。上述研究可为充填结构面抗剪强度尺寸效应模型建立奠定试验基础。Abstract: To address the shortcomings of the existing studies on the size effect of shear strength of rock joints, which do not consider the effects of differences in the filling degree. Firstly, four continuous-size natural joint morphologies with the similar average asperity height and average undulation angle are selected based on the progressively magnifying method, and the joint panels are produced by using the 3D printing technology. Secondly, the infilled joints with five infill ratios are prepared by combining the rock-like material preparation method and the millimeter-level filling devices. Finally, using the direct shear test system for large-scale joints independently developed by the anthors-research group, the laboratory direct shear tests under three normal stress conditions are carried out to obtain the shear mechanics and damage characteristics of the infilled joints. The size effects of the critical infill ratio and shear strength are analyzed. The results show that as the infill ratio increases, the shear damage mode of the joint is mainly changed from "rock-rock" shear fracture to "rock-soil interface" sliding damage, and the normalized peak shear strength gradually decreases until it reaches the critical infill ratio and tends to be stable. As the size of the joints increases, the critical infill ratio gradually increases, ranging from 1.6 to 2.0. There is a more obvious positive size effect on the shear strength of the unfilled joints, while the size effects on the shear strength of the infilled joints are not obvious. Through the analysis of the size effect mechanism, without considering the influences of the average undulation angle of the joints, it is found that the average undulation height is the main factor affecting the size effects of the critical infill ratio and shear strength. The above research can lay an experimental foundation for establishing the size effect model for shear strength of the infilled joints.
-
0. 引言
长距离引调水工程是一项解决中国北方部分地区水资源匮乏所采用的规模巨大且意义深远的水利基础建设项目[1]。近年来,输水渠道和堤坝工程规模越来越大,从几公里到几十、几百甚至是上千公里,工程条件复杂、环境恶劣[2]。引额济乌一期项目位于新疆北部,是一项跨流域、长距离的调水工程。输水渠道在冻融循环、季节性输水、高纬度强光照等影响因素下可能会存在渗漏安全隐患,降低渠堤的渗流稳定性,导致溃堤等安全事故,将会对沿线地区的经济和人民财产安全造成不可估量的损失。
渠堤渗漏监测通常采用渗压计、测压管、量水堰等监测仪器对构筑物的代表性点进行监测,通过单点的测值来反映整体渗流情况。但出于成本考虑,渠道监测断面布置稀疏,受仪器和人员随机误差影响大,极易出现较长距离的漏测、误测的情况,给长距离渠道的安全运行管理带来了挑战。基于分布式光纤温度传感技术,通过监测渠堤不同位置的温度变化值来推算其渗流情况是一种新型的渗流监测技术[3-4]。与传统渗漏监测方法相比较,分布式光纤测渗技术具有抗高压、抗电磁干扰、耐腐蚀、耐高温、防雷击、成本低廉、施工过程简单等特点,非常适合在岩土体实现长距离分布式监测。随着分布式光纤解析技术的日益完善,大量的学者开展了各类基于分布式光纤的测温系统研究[5-7],促进了该技术日趋成熟。
本文提出了一种基于拉曼光时域反射原理的新型渗流监测光缆型式,并研发了可用于长距离输水渠道的分布式光纤拉曼渗流监测技术,通过理论研究、室内试验以及现场应用,验证了该技术的适用性。
1. 高寒区渠道渗漏传感光缆设计
现有的DTS技术(分布式光纤温度传感技术)是将发热材料产生的热量直接传递给测温光纤,当外界环境存在渗流时,部分热量随渗流向外散失,导致测温光纤接收到的热量减少,测点温度低于无渗流的情形,由此来判断渗流的存在。但在实际工程中,由于测温光纤在渗流存在的情况下依旧能从发热材料接收到较多的热量,温度变化程度较小,敏感度低[8]。本文设计并制作了采用特殊封装技术和护套材料的测量光缆。该光缆结构为带加热功能双层四纤非铠装拉曼光缆(光缆结构如图1),该结构可以抵御北疆输水干渠现场零下20℃的低温,保证光缆安全过冬。
图1中1为隔热橡胶圆柱、21为1号光纤套管、22为2号光纤套管、31为1号发热导线、32为2号发热导线、4为氟塑料层、5为钢带、6为导热外护套。
2. 光纤渗漏监测室内试验
2.1 室内试验设计
室内试验设计将光缆置于不同的预设环境(包括:空气、干沙、含水率为5%,10%,15%,20%,30%和饱和的砂土、纯水)中以验证光缆的适用性。试验装置如图2所示。DTS解调仪是解析光缆温度信息,并将数据传输给电脑的重要仪器设备;环境模拟箱是大型水箱,用来放置试验所需的模拟环境。
试验时将模拟环境加入环境模拟箱,再将光缆埋设于模拟环境中,开展各种环境下的光缆升温试验。
2.2 室内试验结果分析
综合对比与分析1号光纤与2号光纤的温升状态,如图3与图4所示。可以看出光纤在不同环境下的温度变化值均不相同。以2号光纤的温升为例,在空气环境中光纤温升幅度最大,超过了13℃;在砂环境中光纤温升幅度较在空气环境中小一点,但也超过了11℃;在纯水环境中光纤温升幅度最小,温度升高了6.53℃;而在各种不同含水率的砂环境中光纤温升幅度相差不大,但存在差异。这些数据表明,在不同的环境中该新型光缆均可反映出环境特征,验证了光缆用于堤坝渗漏监测的可行性。
![]() 图 3 1号光纤在不同环境下温升对比图Figure 3. Comparison of temperature rises of fiber No. 1 under different environments
图 3 1号光纤在不同环境下温升对比图Figure 3. Comparison of temperature rises of fiber No. 1 under different environments![]() 图 4 2号光纤在不同环境下温升对比图Figure 4. Comparison of temperature rises of fiber No. 2 under different environments
图 4 2号光纤在不同环境下温升对比图Figure 4. Comparison of temperature rises of fiber No. 2 under different environments3. 光纤渗漏监测现场原型试验
为研究新型分布式光纤渗流监测技术的适用性与仪器现场安装埋设技术,依托引额济乌一期工程开展了渠堤渗漏现场试验研究与验证。
3.1 试验段布置方案
图5为新疆某输水渠道照片。选择在引额济乌总干渠+70断面附近进行现场试验,该处由于铺设横向排水管的需要,对渠坡原有防渗结构进行了拆除,方便现场安装分布式渗漏监测仪器。考虑到渠道的对称型式,只在渠道一侧的渠堤上布设渗漏光缆(布置剖面见图6),用于测量渠堤防渗膜后的实际渗漏水位高度,为后期研究渠坡变形破坏提供实测数据。
![]() 图 5 非运行期时新疆某输水渠道图片Figure 5. Picture of a water transfer in Xinjiang during non-operational period
图 5 非运行期时新疆某输水渠道图片Figure 5. Picture of a water transfer in Xinjiang during non-operational period为验证分布式监测技术的可行性和精度,在试验段的局部位置安装埋设了传统的孔隙水压力计,并加装自动化测读装置,通过物联网将测量数据上传至位于南京水利科学研究院的服务器内。如图7所示,在渠底防渗膜下部布设两只孔隙水压力计,在坡顶以下11 m位置,布设3只孔隙水压力计,孔隙水压力计的安装要求参照《土石坝安全监测技术规范(SL551— 2012)》。
![]() 图 7 渗漏光缆和孔隙水压力计布设位置示意图Figure 7. Schematic diagram of placement of pore water pressure gauge and cable
图 7 渗漏光缆和孔隙水压力计布设位置示意图Figure 7. Schematic diagram of placement of pore water pressure gauge and cable3.2 试验段测温光纤安装埋设技术
现场光缆布设方案见图8。
埋设步骤:①将要铺设的光缆一头熔接跳线,另一头相互熔接成一体;②依图6和7在渠坡土体中开挖宽约15 cm、深约50 cm的光缆沟,光缆沟间隔2 m,依次开挖10条,相互连通;③在光缆沟底部摊铺、压实厚约10 cm的剔除过大块砾石的原岸坡土料;④在光缆沟内铺设好光缆,光缆检查合格后回填光缆沟,小型振动碾压实;⑤光缆的光损检查合格后,铺设防渗膜和衬砌板。
经现场实际踏勘、放样,依据光缆布设方案安装光缆后将光缆引出至渠顶。同沟埋设孔隙水压力计与光缆,以保证测值的对比性,安装时记录仪器实际安装高程,并将电缆线呈S型顺光缆沟引出至堤顶。
采用光功率计测试光缆的工作状态,检查合格后,采用人工结合小型机械,进行渠坡的削坡、整平和压实工作。待摊铺一层厚约10 cm的素砂浆找平层后,铺设两布一膜,采用防水膜焊接机,将新铺设的两布一膜与老膜连成一体,检测合格后,在两布一膜上部铺设六棱块衬砌板。现场施工完毕后,将孔隙水压力计的电缆线汇集到光缆在渠顶的露头位置,并安装由南京水利科学研究院研制的自动化采集设备,开始监测渠道膜后水位随渠道水位的变化情况。
3.3 光纤测点定位分析
根据渠道运行的规律,分别在渠道通水后、渠道通水期间、渠道停水前逐渐降低运行水位时以及渠道停水后等有代表性的时间点内进行测量。为了更好的发挥渗漏监测光缆的优点,在正式测量前开展了点加热法的光纤定位工作,得到了光缆1号纤和2号纤的起始测量位置和终了测量位置。
如图9所示,为了测量方便,测量前将1号纤和2号纤串联成一根光纤,试验过程中通过拉曼光纤解调仪同时测量,保证了测量数据的时效性和可对比性,能有效减少其他试验因素的干扰。从图9中可以明显看出,在光纤距离向22.5,189.5,205.5和370.5这4个点上,光纤测值有明显的变化,说明点加热定位技术在现场条件下能有效定位光纤测点的位置,将光纤测量数据与光纤实际安装位置一一对应。
依据笔者已有的监测经验,为有效消除系统测量误差对数据的干扰,本次试验选择加热系统未工作前6次测值的平均值作为各个测点的基准值,待光纤温升数值逐渐趋于稳定,取稳定后6次测值的平均值作为各个测点加热后的温度值,前后两值相减,即可得到光纤各点的温升值。
3.4 监测结果分析
为更好地通过数值来判断光缆所处位置的渗流情况,对温升曲线进行了拟合,得到相应的量化指标,温升曲线拟合公式如下所示:
, (1) 式中,K为环境特征值,反映温度的增长速率。
根据光纤渗漏监测室内试验的成果,采用式(1)分析光纤每个点的温升曲线,可得各个点的K值,绘制曲线如图10所示。
由于光缆呈S型布置,从曲线形式上可以看出,渠道膜后渗水对光缆各点K值有较明显的影响,即渗水区域的光纤K值均在一定区间波动。依据前期室内试验的研究成果,确定温差3℃的点为膜后水位的临界点判断标准,K值大于0.7为膜后水位的临界点判断标准,现场代表监测数据分析结果如表1所示。
表 1 光纤测渗漏现场测值分析表Table 1. Analysis of measured values of optical fiber leakage日期 光纤在水位以上的长度/m 水面距离孔压的高度/m 孔压相应的测值/m 2019-07-22 温差法 56.5~66 3.25 3.175 85.5~93.5 3.61 116.5~122.5 4.03 144.5~152.5 3.62 2019-07-22 K值法 56~65.5 3.25 84.5~93 3.50 116.5~122.5 4.03 144.5~152 3.73 2019-09-19 温差法 50.5~70 1.02 0.685 82~101.5 1.04 109~130.5 0.57 140~157.5 1.50 2019-09-19 K值法 51~70 1.13 82.5~101 1.26 111~130 1.13 141.5~160.5 1.16 上述的两种分析判断方法,其结果基本一致,与孔隙水压力的测值较为接近。由于本次光纤测量以0.5 m为距离单位进行测量的,可以形象的认为光纤上每隔0.5 m有一个传感器。根据光纤埋设安装图纸可知,当膜后水位位于两个光纤测点之间时,采用光纤数据判断水位的高度,会与孔隙水压力计测值有一定差距,该差值最大值为0.5 m。由于光纤安装呈S型分布,上述对水位的分析判断,往往采用两个边界点,因此该种测量方法与孔隙水压力计测值的最大差值为1 m。光纤测量的平均值与孔压测值相比,误差在0.5 m以内,完全达到了光纤测量精度,说明采用光纤渗漏监测技术监测现场膜后水位,测值准确,能够适应现场测量条件,证明了光纤渗漏监测技术在高寒区长距离输水渠道应用的可行性和可靠性。
4. 结论
本文基于拉曼光时域反射原理研发了分布式光纤拉曼渗流监测技术,提高了光缆测温敏感性和抗冻性,可用于高寒区长距离输水渠道渗漏监测。结论如下:
(1)室内模拟试验结果表明新型光缆在不同环境中均可反映出环境特征,验证了光缆用于堤坝渗漏监测的可行性。
(2)现场采用点加热定位技术能有效定位光纤测点的位置,实现了光纤测量数据与光纤实际安装位置的一一对应。
(3)本次测量光纤采样点间距为0.5 m,光纤测量的平均值与孔隙水压力计测值差小于0.5 m,差值在理论范围内,说明光纤渗漏监测技术监测现场膜后水位测值准确,完全能够适应现场测量条件。
分布式光纤拉曼渗流监测技术克服了传统方法间隔长、可靠性差、施工成本高等缺点;可实现长距离分布式测量、施工简便、适应性强,适合于推广应用。
-
![]()
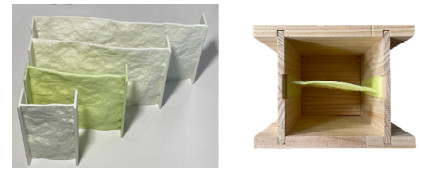
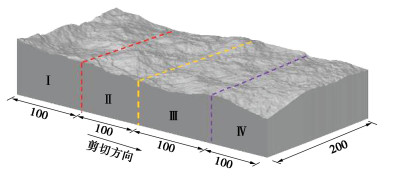
图 1 结构面样本渐进扩大法示意图
Figure 1. Schematic diagram of progressively magnifying method for joint sample
![]()
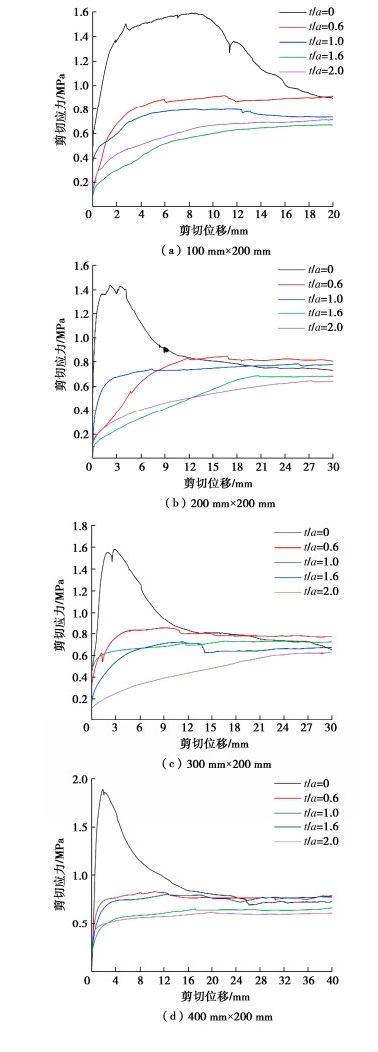
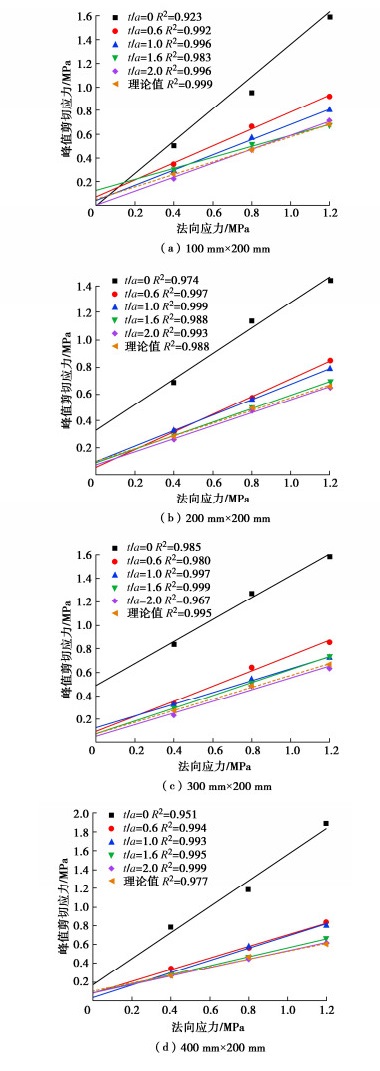
图 6 =1.2 MPa下系列尺寸结构面剪应力-剪切位移曲线
Figure 6. Shear stress-shear displacement curves of joints with series sizes at =1.2 MPa
![]()
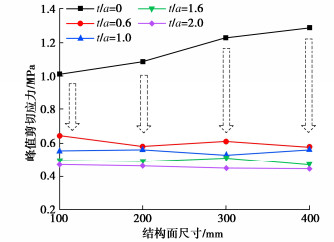
图 7 不同充填度下抗剪强度尺寸效应规律
Figure 7. Size effect laws of shear strength under different infill ratios
![]()
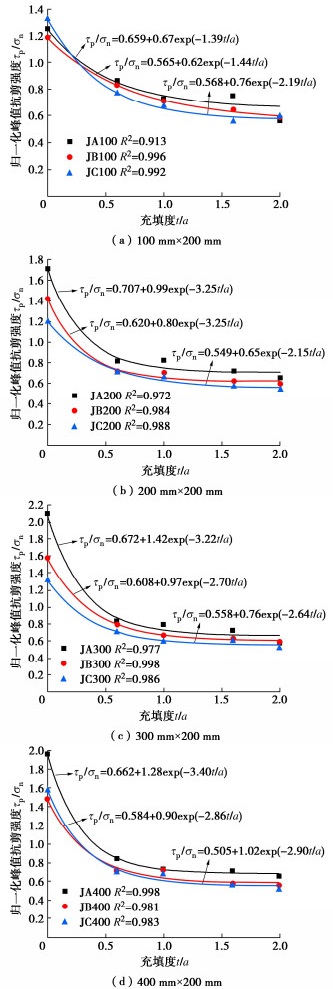
图 8 归一化峰值抗剪强度随充填度的变化规律
Figure 8. Variation laws of normalized peak shear strength with infill ratios
![]()
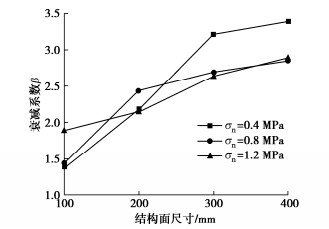
图 11 不同尺寸结构面衰减系数变化趋势
Figure 11. Variation trend of attenuation coefficient of joints with different sizes
表 1 类岩石材料配合比
Table 1 Mix ratios of rock-like materials
水泥 砂 大理
石粉树脂 固化剂 促凝剂 保水剂 37% 24% 30% 6% 1% 1% 1%  下载: 导出CSV
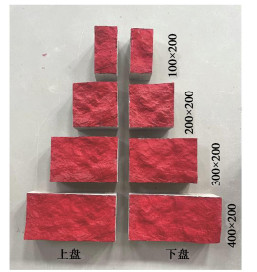
表 2 系列尺寸充填结构面剪切破坏模式
Table 2 Shear failure modes of infilled joints with series sizes
充填度t/a 结构面尺寸/(mm×mm) 破坏模式 100×200 200×200 300×200 400×200 0.0 


“岩-岩”剪断破坏 0.6 


以“岩-岩”剪损及“岩-土界面”滑动破坏为主 1.0 


1.6 


2.0 


以“岩-土界面”滑动破坏为主 注:其中充填度t/a=1.6时,尺寸为100 mm×200 mm、200 mm×200 mm的结构面破坏模式以“岩-土界面”滑动破坏为主。
下载: 导出CSV
-
[1] JIANG Q, SONG L B, YAN F, et al. Experimental investigation of anisotropic wear damage for natural joints under direct shearing test[J]. International Journal of Geomechanics, 2020, 20(4): 04020015. doi: 10.1061/(ASCE)GM.1943-5622.0001617
[2] ZHOU D, ZHAO Z H, LI B, et al. Permeability evolution of grout infilled fractures subjected to triaxial compression with low confining pressure[J]. Tunnelling and Underground Space Technology, 2020, 104: 103539. doi: 10.1016/j.tust.2020.103539
[3] 祝艳波, 张宇轩, 李文杰, 等. 粗糙度对硅质板岩-泥岩界面强度与变形特性影响试验研究[J]. 岩石力学与工程学报, 2022, 41(7): 1358-1372. https://www.cnki.com.cn/Article/CJFDTOTAL-YSLX202207006.htm ZHU Yanbo, ZHANG Yuxuan, LI Wenjie, et al. Experimental study on effect of roughness on strength and deformation characteristics of interface between siliceous slate and mudstone[J]. Chinese Journal of Rock Mechanics and Engineering, 2022, 41(7): 1358-1372. (in Chinese) https://www.cnki.com.cn/Article/CJFDTOTAL-YSLX202207006.htm
[4] ZHAO Z H, LIN T, CHEN Y D, et al. Shear behaviors of natural rock fractures infilled with cemented calcite[J]. Computers and Geotechnics, 2022, 141: 104493. doi: 10.1016/j.compgeo.2021.104493
[5] HAN G S, JING H W, JIANG Y J, et al. Effect of cyclic loading on the shear behaviours of both unfilled and infilled rough rock joints under constant normal stiffness conditions[J]. Rock Mechanics and Rock Engineering, 2020, 53(1): 31-57. doi: 10.1007/s00603-019-01866-w
[6] WU D Y, CHEN F, TANG L, et al. Influence of weak interlayer filling state on the failure patterns of natural rock joints[J]. International Journal of Geomechanics, 2022, 22(7): 04022086. doi: 10.1061/(ASCE)GM.1943-5622.0002410
[7] 许万忠, 林杭, 曹日红. 充填粗糙节理直剪数值模拟宏细观分析[J]. 西南交通大学学报, 2018, 53(3): 548-557. https://www.cnki.com.cn/Article/CJFDTOTAL-XNJT201803016.htm XU Wanzhong, LIN Hang, CAO Rihong. Simulation and macro-mesoscopic parameter analysis for direct shear of filled rough joints[J]. Journal of Southwest Jiaotong University, 2018, 53(3): 548-557. (in Chinese) https://www.cnki.com.cn/Article/CJFDTOTAL-XNJT201803016.htm
[8] LADANYI B, ARCHAMBAULT G. Shear strength and deformability of filled indented joints[C]//Proceedings of International Symposium on Geotechnics of Structurally Complex Formations, Capri, Italy, 1977.
[9] TANG J Z, YANG S Q, ZHAO Y L, et al. Experimental and numerical modeling of the shear behavior of filled rough joints[J]. Computers and Geotechnics, 2020, 121: 103479. doi: 10.1016/j.compgeo.2020.103479
[10] 肖维民, 余欢, 朱占元, 等. 薄层充填岩石节理剪胀特性试验研究[J]. 岩土工程学报, 2020, 42(8): 1499-1508. doi: 10.11779/CJGE202008015 XIAO Weimin, YU Huan, ZHU Zhanyuan, et al. Experimental study on shear dilatancy characteristics of thinly-infilled rock joints[J]. Chinese Journal of Geotechnical Engineering, 2020, 42(8): 1499-1508. (in Chinese) doi: 10.11779/CJGE202008015
[11] 肖维民, 余欢, 李锐, 等. 薄层充填岩石节理抗剪强度特性试验研究[J]. 岩石力学与工程学报, 2019, 38(增刊2): 3420-3428. https://www.cnki.com.cn/Article/CJFDTOTAL-YSLX2019S2017.htm XIAO Weimin, YU Huan, LI Rui, et al. Experimental research on the shear strength of thinly-infilled rock joints during shearing[J]. Chinese Journal of Rock Mechanics and Engineering, 2019, 38(S2): 3420-3428. (in Chinese) https://www.cnki.com.cn/Article/CJFDTOTAL-YSLX2019S2017.htm
[12] KARAKUS M, LIU Y, ZHANG G C, et al. A new shear strength model incorporating influence of infill materials for rock joints[J]. Geomechanics and Geophysics for Geo-Energy and Geo-Resources, 2016, 2(3): 183-193. doi: 10.1007/s40948-016-0032-4
[13] PAPALIANGAS T, HENCHER S R, LUMSDEN A C, et al. The effect of frictional fill thickness on the shear strength of rock discontinuities[J]. International Journal of Rock Mechanics and Mining Sciences and Geomechanics Abstracts, 1993, 30(2): 81-91.
[14] 史玲, 蔡美峰, 赵坚. 充填节理破坏机理及实验[J]. 北京科技大学学报, 2012, 34(3): 253-259. https://www.cnki.com.cn/Article/CJFDTOTAL-BJKD201203003.htm SHI Ling, CAI Meifeng, ZHAO Jian. Fracture mechanism and experiment of infilled rock joints[J]. Journal of University of Science and Technology Beijing, 2012, 34(3): 253-259. (in Chinese) https://www.cnki.com.cn/Article/CJFDTOTAL-BJKD201203003.htm
[15] ZHAO Y L, LI Y, CHANG L, et al. Shear behaviors of clay-infilled joint with different water contents: experiment and model[J]. Arabian Journal of Geosciences, 2021, 14(17): 1-16.
[16] PHIEN-WEJ N, SHRESTHA U B, RANTUCCI G. Effect of infill thickness on shear behaviour of rock joints[C]// Proceedings of the International Conference on Rock Joints, Loen, 1990: 289-294.
[17] INDRARATNA B, WELIDENIYA H S, BROWN E T. A shear strength model for idealized filled joints under constant normal stiffness[J]. Géotechnique, 2005, 55(3): 215-226. doi: 10.1680/geot.2005.55.3.215
[18] SHRIVASTAVA A K, RAO K S. Physical modeling of shear behavior of infilled rock joints under CNL and CNS boundary conditions[J]. Rock Mechanics and Rock Engineering, 2018, 51(1): 101-118. doi: 10.1007/s00603-017-1318-8
[19] JAHANIAN H, SADAGHIANI M H. Experimental study on the shear strength of sandy clay infilled regular rough rock joints[J]. Rock Mechanics and Rock Engineering, 2015, 48(3): 907-922. doi: 10.1007/s00603-014-0643-4
[20] ZHAO Y L, ZHANG L Y, WANG W J, et al. Experimental study on shear behavior and a revised shear strength model for infilled rock joints[J]. International Journal of Geomechanics, 2020, 20(9): 04020141. doi: 10.1061/(ASCE)GM.1943-5622.0001781
[21] WEI Y, MING M. Investigation on the scale dependence of shear mechanical behavior of rock joints using DEM simulation[J]. Computational Particle Mechanics, 2023, 10: 1613-1627. doi: 10.1007/s40571-023-00577-y
[22] JEFFERY M, HUANG J, FITYUS S, et al. A large-scale application of the stochastic approach for estimating the shear strength of natural rock discontinuities[J]. Rock Mechanics and Rock Engineering, 2023, 56(8): 6061-6078. doi: 10.1007/s00603-023-03393-1
[23] 罗战友, 杜时贵, 黄曼. 岩石结构面峰值摩擦角应力效应试验研究[J]. 岩石力学与工程学报, 2014, 33(6): 1142-1148. https://www.cnki.com.cn/Article/CJFDTOTAL-YSLX201406007.htm LUO Zhanyou, DU Shigui, HUANG Man. Experimental study of stress effect on peak friction angle of rock structural plane[J]. Chinese Journal of Rock Mechanics and Engineering, 2014, 33(6): 1142-1148. (in Chinese) https://www.cnki.com.cn/Article/CJFDTOTAL-YSLX201406007.htm
[24] BANDIS S C, LUMSDEN A C, BARTON N R. Experimental studies of scale effects on the shear behaviour of rock joints[J]. International Journal of Rock Mechanics and Mining Science and Geomechanics Abstracts, 1981, 18(1): 1-21.
[25] HUANG M, HONG C J, DU S G, et al. Experimental technology for the shear strength of the series-scale rock joint model[J]. Rock Mechanics and Rock Engineering, 2020, 53(12): 5677-5695. doi: 10.1007/s00603-020-02241-w
[26] JOHANSSON F. Influence of scale and matedness on the peak shear strength of fresh, unweathered rock joints[J]. International Journal of Rock Mechanics and Mining Sciences, 2016, 82: 36-47. doi: 10.1016/j.ijrmms.2015.11.010
[27] BAHAADDINI M, HAGAN P C, MITRA R, et al. Scale effect on the shear behaviour of rock joints based on a numerical study[J]. Engineering Geology, 2014, 181: 212-223. doi: 10.1016/j.enggeo.2014.07.018
[28] KANG Y S, HOU C C, LIU B, et al. Influence of water content on the shear strength of rock joints with clay-rich fillings[J]. Rock Mechanics and Rock Engineering, 2023, 56(2): 1437-1449. doi: 10.1007/s00603-022-03158-2
[29] MENG F Z, ZHOU H, WANG Z Q, et al. Influences of shear history and infilling on the mechanical characteristics and acoustic emissions of joints[J]. Rock Mechanics and Rock Engineering, 2017, 50(8): 2039-2057. doi: 10.1007/s00603-017-1207-1
[30] SHE C X, SUN F T. Study of the peak shear strength of a cement-filled hard rock joint[J]. Rock Mechanics and Rock Engineering, 2018, 51(3): 713-728. doi: 10.1007/s00603-017-1358-0
[31] TATONE B, GRASSELLI G. An investigation of discontinuity roughness scale dependency using high- resolution surface measurements[J]. Rock Mechanics and Rock Engineering, 2013, 46(4): 657-681. doi: 10.1007/s00603-012-0294-2
[32] 杜时贵, 吕原君, 罗战友, 等. 岩体结构面抗剪强度尺寸效应联合试验系统及初级应用研究[J]. 岩石力学与工程学报, 2021, 40(7): 1337-1349. https://www.cnki.com.cn/Article/CJFDTOTAL-YSLX202107002.htm DU Shigui, LÜ Yuanjun, LUO Zhanyou, et al. Combined test system for size effect of rock joint shear strength and its primary application research[J]. Chinese Journal of Rock Mechanics and Engineering, 2021, 40(7): 1337-1349. (in Chinese) https://www.cnki.com.cn/Article/CJFDTOTAL-YSLX202107002.htm
[33] BAN L R, DU W S, QI C Z, et al. Modified 2D roughness parameters for rock joints at two different scales and their correlation with JRC[J]. International Journal of Rock Mechanics and Mining Sciences, 2021, 137: 104549. doi: 10.1016/j.ijrmms.2020.104549
-
其他相关附件


计量
- 文章访问数: 581
- HTML全文浏览量: 78
- PDF下载量: 143