Stress inversion based on microseismic monitoring and its engineering application
-
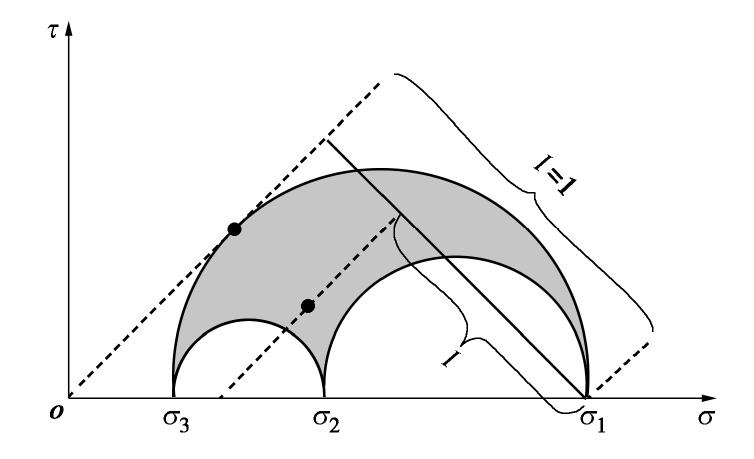
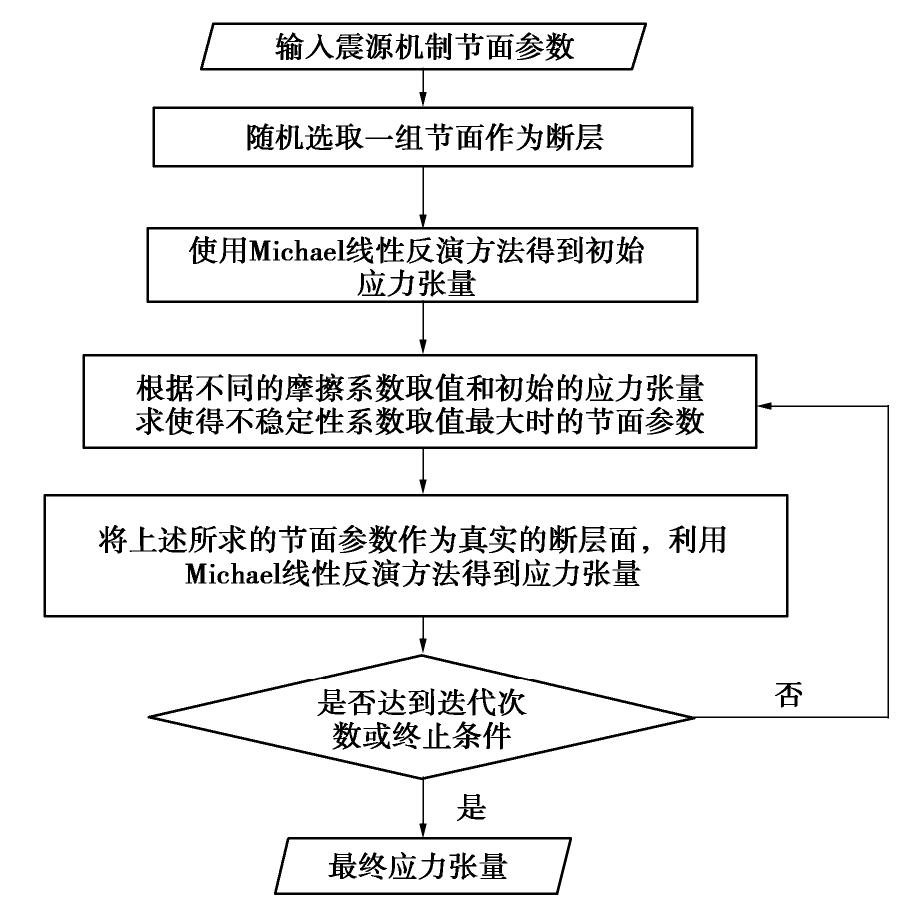
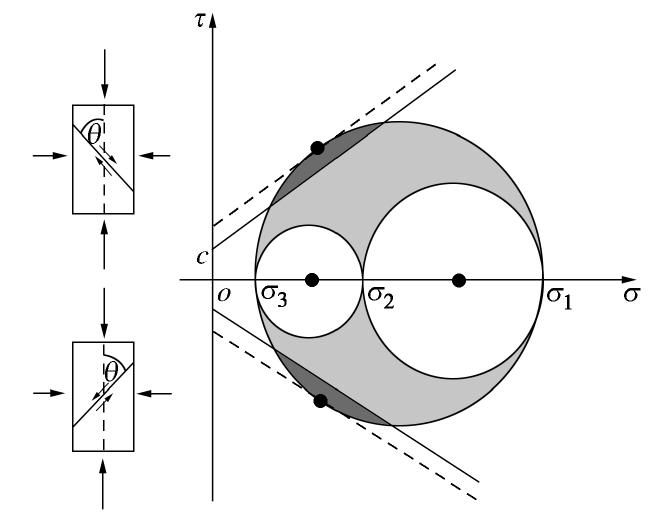
摘要: 确定工程中岩体所处的应力场环境是灾害监测预警与应用的基础,在微震震源机制解的基础上探索采用联合迭代反演方法反演应力场,该方法采用不稳定性系数I作为约束结合经典的线性反演方法反演应力场,有效避免了两个断层面的模糊性对反演结果的不利影响,提高了反演精度。通过多次反演选取能够产生最大不稳定性系数的摩擦系数
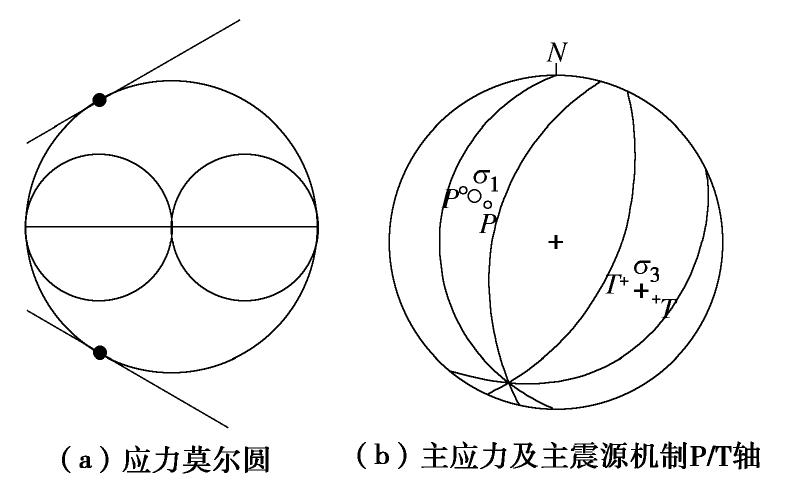
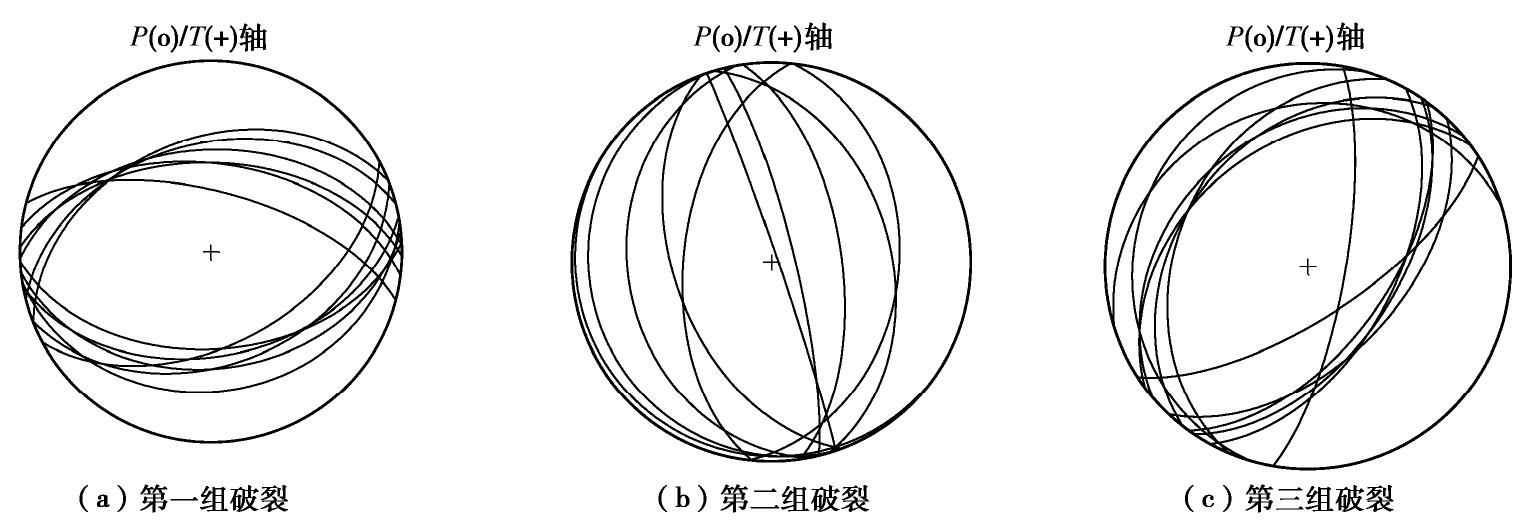
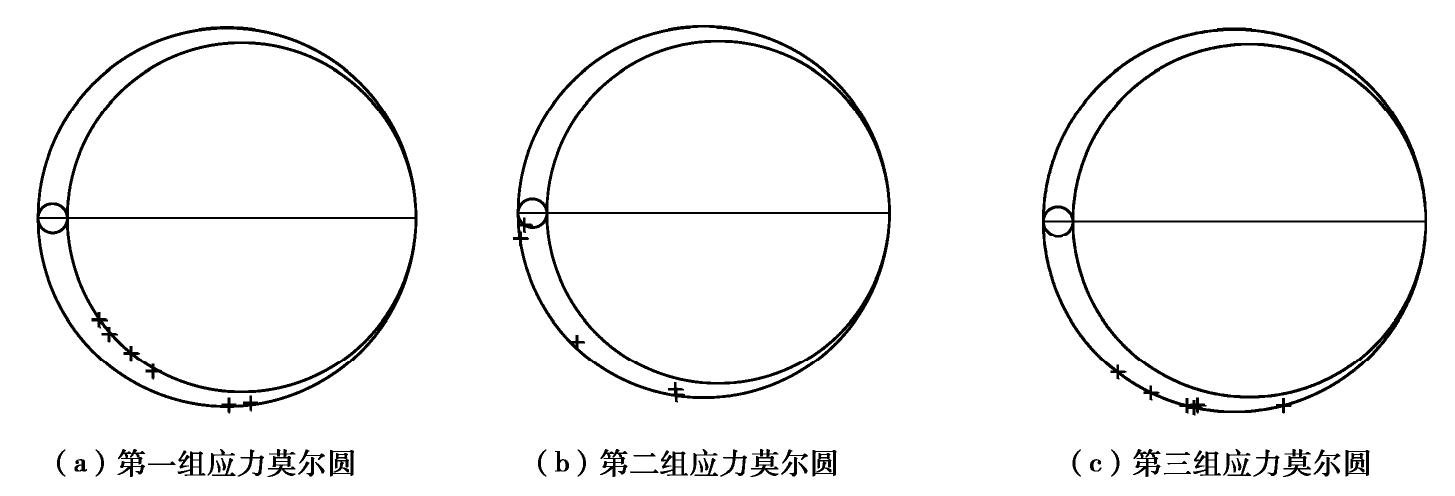
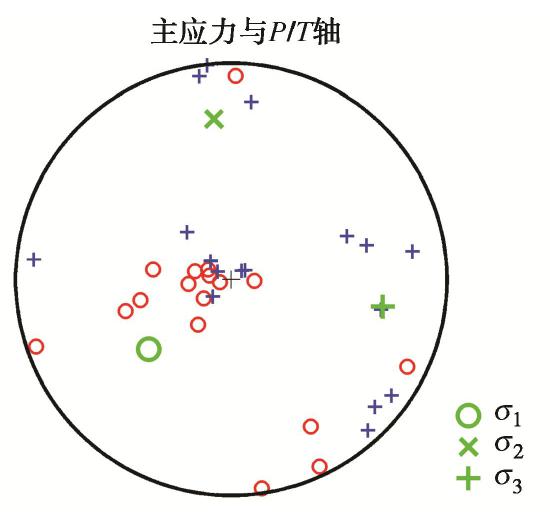
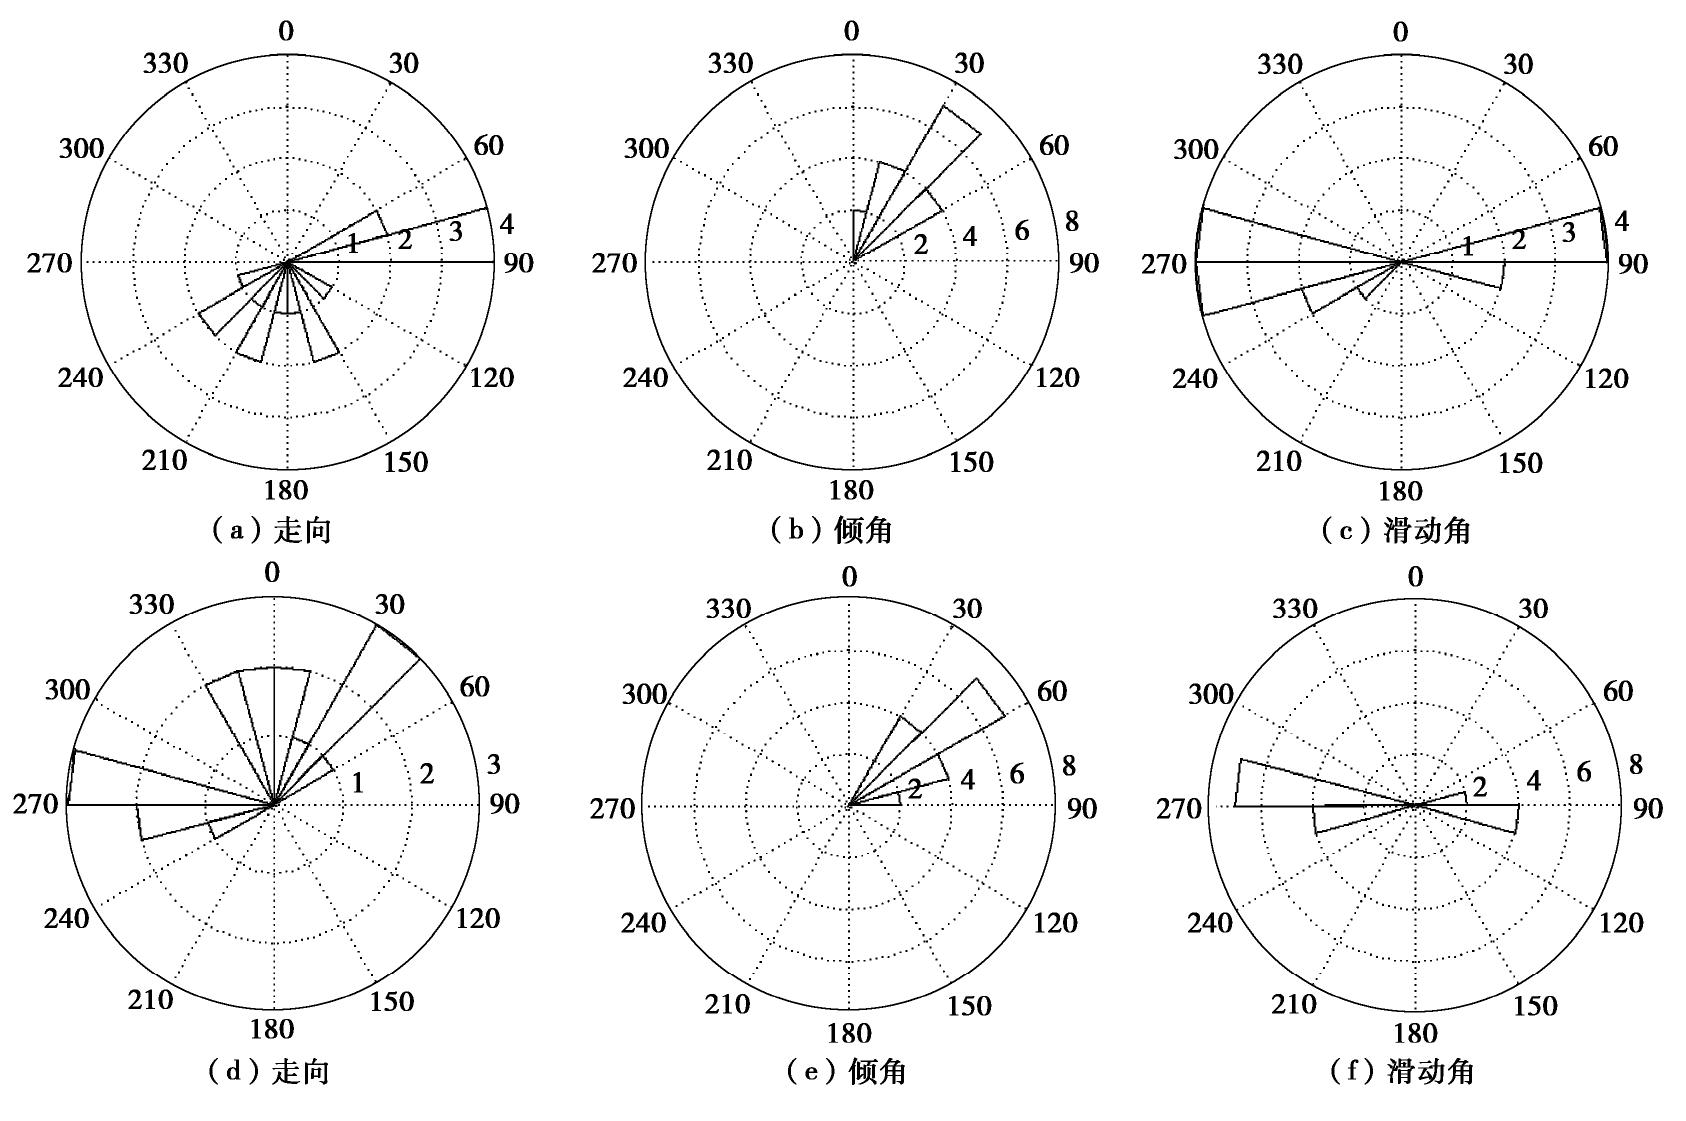
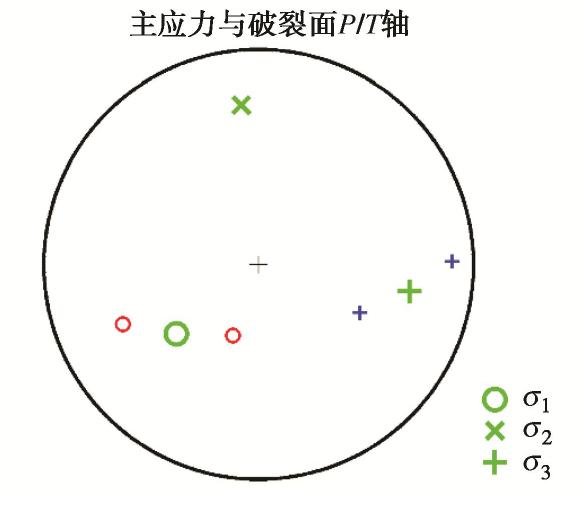
μ 作为岩体的摩擦系数,并通过应力与摩擦系数定义了主破裂面。对一起典型的岩体破裂微震定位事件案例,首先分析了破裂类型以及破裂面方位,并对破裂的时间演化进行了推测;其次分析了加入不同程度噪声对应力反演结果的影响,并给出了分析结果;最后对应力场分布进行了分析,结果表明最大主应力轴的方位角与倾角为229.86°/48.57°;中间主应力轴的方位角与倾角为353.89°/26.28°;最小主应力轴的方位角与倾角为100.08°/29.44°,应力的分布与震源机制解P/T轴分布具有一致性;主破裂面的方位较好地符合了此次微震事件实际监测结果。Abstract: Determining the stress field environment of rock mass in engineering is the basis of disaster monitoring, disaster warning and its application. A joint iterative inversion method is used to retrieve the stress field based on the focal mechanism. The method uses instability coefficient I as a constraint and combines it with the classical linear inversion method to retrieve the stress field, which can effectively avoid the negative influences of the fuzziness of the two fault planes on the inversion results and improve the accuracy of the results. To determine the optimal friction coefficient of rock mass, the friction coefficient which can produce the maximum instability coefficient is selected as that of rock mass through multiple inversion. The concept of the main fault plane is defined by the friction coefficient and stress. A typical case of rock fracture microseismic location event is presented and analyzed. Firstly, the source mechanism is analyzed, the type of fracture and the orientation of the fracture surface are obtained, and the time evolution of the fracture is predicted. Secondly, the error of the stress inversion results with different levels of noise is analyzed, and the results are presented. Finally, the distributions of stress filed are analyzed, and the results show that the azimuth angle and inclination angle of the maximum principal stress axis are 229.86º and 48.57º. The azimuth angle and inclination angle of the intermediate principal stress axis are 353.89º and 26.28º. The azimuth angle and inclination angle of the minimum principal stress axis are 100.08ºand 29.44º. The distribution of stress axes is consistent with the P/T axes of the focal mechanism. The orientation of the main fault plane is in great agreement with the actual monitoring results. -
0. 引言
隧道是现代化城市和城市间地下交通、运输的重大基础设施,尤其海底隧道、跨江河隧道等建设,提出了一些列挑战和机遇。土压力是评判隧道施工质量、健康服役、抗震性能等关键力学指标,但是受限于土体内部受力变形机制未明确,准确获得土压力问题具有复杂性。
近些年来,众多学者在隧道围压计算方法、物理试验及土压力测试方法方面,取得重要进展和代表性成果,在此做简要阐述和归纳。Terzaghi[1]基于活动门试验,探讨了土拱效应的产生机理,提出了极限平衡方法下隧道拱顶松动区土压力计算公式;陈若曦等[2]采用主应力线偏转方法,修正了不同土体条件下侧向土压力系数计算方法;刘晶波等[3]开展动力离心试验,研究了不同埋深条件下矩形隧道地震动土压力响应;Wang等[4]基于一系列离心模型试验,研究了干砂中不同方向地震荷载下不同隧道模型的地震响应,提出了垂直方向地震荷载会显著提升隧道衬砌动态弯矩;Cilingir等[5]采用动力离心试验和数值模拟方法,研究不同类型地震动输入对圆形和方形隧道抗震性能影响,发现隧道衬砌的围压峰值及增量主要受输入加速度峰值影响,与地震持续时间及频率含量无关;芮瑞等[6]基于自主研发标定装置,对膜式土压力盒进行加卸载标定试验,结果表明加载过程标定曲线为线性分布,卸载过程标定曲线可通过指数拟合;魏永权等[7]开展了大模量土体中微型土压力传感器BY-4离心标定试验,揭示了引起标定曲线发生非线性的原因为土体模量变化,基于匹配误差对标定曲线进行修正;梁波等[8]详细介绍了标定试验常用的加压方式,并结合试验所用两种土压力盒性质,选用固结仪作为标定过程的加压设备;蔡正银等[9]开展离心模型土压力盒标定试验,分析温度、砂层厚度、土颗粒粒径变化对标定系数的影响。
综上所述,可以发现现有研究多集中于隧道土压力理论计算及动力或静力荷载下围压响应分析,以及地下挡土墙结构土压力测试方法,而关于隧道环境中土压力计测试可靠性问题,尚缺乏对比研究与认知。因此,本文选取线性误差、平均幅值误差、响应速率为指标,对柔性软接触土压计ESP-Ⅱ和两种国际代表性土压传感器进行评估,验证所用土压力计测量可靠性。
1. 试验设备与模型设计
1.1 试验设备
本次模型试验在中国地震局工程力学研究所DCIEM-40-300型离心机上进行(图 1),有效旋转半径5.0 m,台面尺寸1.6 m×0.8 m,最大离心加速度100g,动台台面尺寸1.6 m×0.8 m,振动加速度30g,振动荷载1500 kg,振动频宽10~300 Hz,激振位移10 mm。
![]() 图 1 DCIEM-40-300型离心机振动台系统Figure 1. Shaking table test system of DCIEM-40-300 centrifuge
图 1 DCIEM-40-300型离心机振动台系统Figure 1. Shaking table test system of DCIEM-40-300 centrifuge1.2 土体材料选取
试验所用土体为天津细砂,其主要物理参数:土颗粒相对质量密度Gs为2.641,不均匀系数Cu为1.7,曲率系数Cc为0.96,限制粒径D60为0.185 mm,最大干密度ρdmax和最小干密度ρdmin分别为1.696,1.482 g/cm3。图 2为该砂的级配曲线,采用砂雨法进行制模,控制相对密实度80%。
1.3 隧道设计与制作
查阅文献可知,工程常见圆形隧道直径在6~15 m之间。而在离心模型试验中应考虑模型箱边界效应,故本次试验原型隧道直径设置为10 m,衬砌厚度设置为0.5 m,长度设置为10 m。模型隧道外径及长度根据几何相似比确定即可,对隧道来说,抗震设计主要考虑其抗弯能力,因此模型衬砌设计应以抗弯刚度为主,模型隧道设计依托于抗弯刚度等效原则:
N4EmJm=EpJp。 故本次试验设计选择铝合金作为模型材料,表 1为模型与原型对应的参数指标。
表 1 原型/模型隧道参数Table 1. Parameters of prototype/model tunnel材料参数 原型材料 模型材料 弹性模量/GPa 35.5 71 隧道外径/mm 10000 200 隧道内径/mm 9000 190 衬砌厚度/mm 500 5 隧道长度/mm 20000 400 1.4 模型布设及测试方案
图 3为模型与传感器的总体布设图,根据国家现行规范:《公路隧道设计细则:JTG/T D70—2010》与《铁路隧道设计规范:TB10003—2016》中对隧道界限埋深的定义,计算得到本次试验隧道界限埋深约为10.8~13.5 m,结合试验所用模型箱尺寸,将隧道埋深设置为12.5 m(对应模型0.25 m),为评估柔性软接触式土压力计测试可靠性,在隧道中心断面拱顶、拱腰、拱底分别布设工力所自制的柔性软接触式土压力计ESP-Ⅱ以及两种国际代表性土压力计(美国Measurement公司EPL-D1型土压力计、日本TML公司PDA型土压力计),监测隧道动态及静态衬砌土压力;为测试土体动力响应,按层布设加速度传感器,监测动态加速度变化。
![]() 图 3 离心模型试验设计方案及实物图Figure 3. Design scheme and physical image of centrifugal model tests
图 3 离心模型试验设计方案及实物图Figure 3. Design scheme and physical image of centrifugal model tests图 4所示为本次试验的输入荷载,基于图 4(a)逐级递增的离心加速度,以分析3种土压力计的静力测试精度及指标下隧道衬砌土压力变化特征,基于图 4(b)~(d)依次输入的峰值0.1g正弦波、0.1g EL-Centro波、0.3g EL-Centro波、0.3g正弦波,以分析3种土压力计动力响应敏感性及震后土压力增量变化规律。
2. 静力响应可靠性分析
本节采用线性误差、平均幅值误差作为评价指标,分析静力荷载下位于隧道衬砌上的3种土压力计测试准确性。
根据相关规范《岩土工程仪器基本参数及通用技术条件:GB/T 15406—2007》,线性误差EL、平均幅值误差EA定义如下:
EL=|ΔYLS|maxYFS×100%, (1) EA=|n∑i=1|ΔYES|maxYE|ave×100%。 (2) 式中:ΔYLS为荷载历程上实测值与理论值的最大偏差绝对值,为土压力计的满量程输出(500 kPa);YE为每级荷载真实值,ΔYFS为真实值与测量值的最大偏差。
理论计算方面,选取太沙基松动土压力理论计算隧道拱顶土压力,其余测点土压力基于日本土工学会提出的修正惯用法求解:
σ0=P0exp(−K0tanφ/B1) , (3) σv1=B1γ−cK0tanφ[1−exp(−K0tanφH/B1)]+σ0 , (4) B1=R0cot(φ/8+π/16) , (5) σv2=σv1+W , (6) σh=K0(σv1+γR) 。 (7) 式中:σv1和σv2分别为隧道拱顶和拱底竖向土压力理论值;σh为隧道拱腰侧向土压力理论值;W为隧道自重;K0为侧向土压力系数;c,φ,γ分别为土体黏聚力、内摩擦角、重度;P0为地面附加荷载;R为隧道半径。
根据上式及表 2中数据(—为传感器故障导致数据缺失)计算得到ESP-Ⅱ型、PDA型、EPL-D1型线性误差为19.36%,12.7%,21.0%,平均幅值误差为5.79%,48.2%,22.6%。可以发现柔性软接触式土压力计ESP-Ⅱ的线性误差与两种土压力计接近,而平均幅值误差远小于两者,说明ESP-Ⅱ型土压力计已达到较好的测试可靠性与准确性,与国际静力测试水平相当。
表 2 3种土压力计静力测量值及计算值Table 2. Static measurements and calculated values of three types of soil pressure cells离心加速度/g 土层深度/m 测量值/kPa 计算值/kPa ESP-Ⅱ PDA EPL-D1 5 1.25 9.26 — 37.83 18.13 1.75 4.33 5.82 9.34 11.15 2.25 — 53.01 61.40 34.43 10 2.5 15.66 — 59.52 36.27 3.5 14.10 18.21 25.33 22.30 4.5 — 76.09 83.67 52.57 15 3.75 21.24 — 76.17 54.40 5.25 22.98 33.64 45.13 33.44 6.75 — 94.24 106.14 70.70 20 5 26.14 — 90.65 72.53 7 30.98 51.34 67.03 44.59 9 — 111.45 126.32 88.83 35 8.75 38.52 — 130.59 126.94 12.25 55.01 114.05 142.16 78.04 15.75 — 152.51 178.98 143.24 50 12.5 51.36 — 174.97 181.34 17.5 78.37 174.82 216.41 111.48 22.5 — 191.26 227.81 197.64 3. 动力响应可靠性分析
本节采用响应速率作为评价指标,分析了动力荷载下隧道衬砌上的3种土压力计测试敏感性,及3种土压力计土压力增量变化。
3.1 动力响应敏感性分析
土压力计最重要的动力精度指标为其对动力荷载的敏感程度,采用响应滞时Td(首次土压力峰值与加速度峰值的平均迟滞时间)反应3种土压力计对动力荷载的敏感程度。限于篇幅,本小节仅给出首次振动的动力响应结果,同时对土压力值进行归一化处理,如图 5所示,通过图 5计算得ESP-Ⅱ、PDA、EPL-D1土压力计的平均响应滞时分别为14.9,19.4,15.2 ms,换算成响应速率为67.1,51.5,65.8 Hz,可以发现ESP-Ⅱ的响应速率高于其他两种国际代表性土压力计。综上,ESP-Ⅱ型已达到国际通用的动力测试水平。
3.2 动态土压力增量分析
图 6给出了拱腰位置测点3种土压力计地震前后的动土压力时程,整体上可以看出ESP-Ⅱ动力响应处土压力连续性较好,变化规律一致,而其余两种土压力计动力响应处土压力数据出现了不同程度的跳变。进一步分析数据容易发现,ESP-Ⅱ和PDA的土压力增量显示出相似的变化规律:首次振动土压力增量都产生较大变化,中间两次振动后土压增量逐渐变小,此时拱腰测点附近土体密实度不发生变化,最后一次振动后,土压增量再次变大,而数值存在一定差异,该现象产生的主要原因是土体具有较强结构性,但EPL-D1的土压力增量呈现“负-正”往复变化趋势,与现有认知不符。
![]() 图 6 连续振动荷载下土压力测量结果Figure 6. Time histories of earth pressure under continuous vibration loads
图 6 连续振动荷载下土压力测量结果Figure 6. Time histories of earth pressure under continuous vibration loads3.3 卸荷影响分析
图 7(a)给出了离心力卸载过程中拱腰位置3种土压力计时程曲线,观察可发现,在图中标记的E1、E2处,PDA和EPL-D1土压力曲线都出现了较大的偏折、跳变,EPL-D1偏折尤其明显,而ESP-Ⅱ土压力测量曲线维持了较好的测试连贯性,说明软接触式设计能实现土压力计与土体接触更加稳定。卸载过程3种土压力计测量值随离心加速度变化响应曲线如图 7(b)所示,不难看出3种土压力计测量曲线都呈现出不同程度的“滞后”,即非线性变化特征,主要原因为卸载时土体还保留着上级荷载残余的土压力。
![]() 图 7 卸载过程3种土压力计测量结果Figure 7. Measured results of three types of earth pressure cells during unloading process
图 7 卸载过程3种土压力计测量结果Figure 7. Measured results of three types of earth pressure cells during unloading process4. 结论
(1)静力荷载下,ESP-Ⅱ、PDA、EPL-D1线性误差分别为19.36%,12.7%,21.0%,平均幅值误差为5.79%,48.2%,22.6%,证明ESP-Ⅱ土压力计相比国际两种土压计具有较好静力测试性能。
(2)动力荷载下,ESP-Ⅱ、PDA、EPL-D1土压力计的平均响应速率分别为67.1,51.5,65.8 Hz,ESP-Ⅱ的响应速率略高于其他两种土压力计,具有良好的响应频率;序列地震动荷载下ESP-Ⅱ、PDA测得土压力与EPL-D1不同,呈现一致增量规律,而数值存在一定差异,表明土体具有较强结构性。
(3)卸载过程中,3种土压力计测得数据均呈现不同程度的非线性变化特征,PDA和EPL-D1土压力时程曲线产生了偏折、跳变现象,而ESP-Ⅱ土压力测量曲线保持了较好数据连续性,一定程度说明软接触式设计能实现土压力计与土体的良好接触。
致谢:: 感谢捷克科学院地球物理研究所Václav Vavryčuk教授在应力场反演方面提供的帮助。 -
![]()
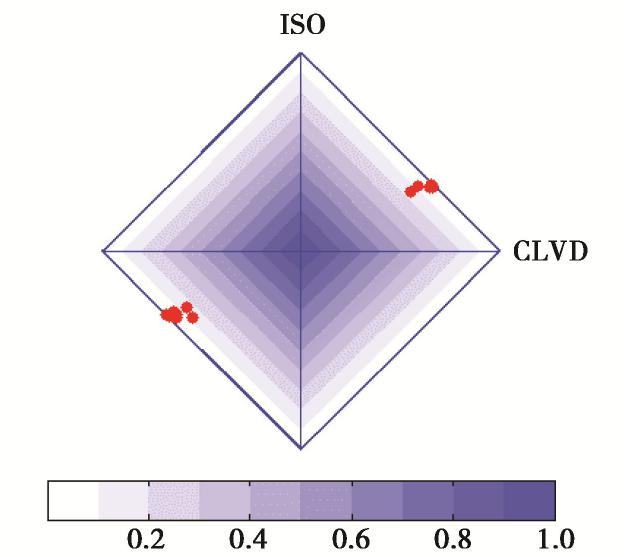
图 10 不同噪声水平下主应力轴的置信度
Figure 10. Confidence levels of principal stress axis with different levels of noise
表 1 震源机制节面1及其节面2参数
Table 1 Fault parameters of nodal planes No. 1 and No. 2
事件编号 走向1/(°) 倾角1/(°) 滑动角1/(°) 走向2/(°) 倾角2/(°) 滑动角2/(°) 1 159.38 49.90 87.55 343.16 40.16 92.89 2 79.30 44.67 -96.12 267.87 45.65 -83.98 3 229.37 33.20 -78.19 35.92 57.58 -97.62 4 87.17 47.93 97.81 255.60 42.65 81.43 5 80.87 27.90 -111.29 284.66 64.15 -79.11 6 252.71 21.71 104.51 57.14 69.01 84.30 7 161.45 9.55 -94.78 346.30 80.47 -89.19 8 196.60 15.20 -83.52 9.89 74.89 -91.75 9 83.77 38.89 79.43 277.25 51.88 98.41 10 123.77 3.39 -127.33 341.15 87.29 -87.93 11 185.47 53.79 -90.46 6.24 36.21 -89.37 12 68.93 40.64 -107.31 271.25 51.55 -75.67 13 233.41 38.63 -82.05 43.28 51.80 -96.29 14 61.81 49.93 85.76 248.37 40.25 95.02 15 169.87 28.82 -91.70 351.81 61.19 -89.06 16 218.12 35.77 -86.69 34.04 54.29 -92.38 17 202.89 35.15 85.17 28.79 54.99 93.39  下载: 导出CSV
表 2 不同噪声水平平均应力误差
Table 2 Average errors of stress direction with different levels of noise
噪声水平/(°) 应力轴误差 σ1 σ2 σ3 5 12 16 10 10 15 20 15 15 17 26 21 20 22 31 23
下载: 导出CSV
表 3 应力反演结果
Table 3 Results of stress inversion
应力主轴 σ1 σ2 σ3 R 方位角/倾角 方位角/倾角 方位角/倾角 迭代反演 229.86°/48.57° 353.89°/26.28° 100.08°/29.44° 0.9
下载: 导出CSV
表 4 主破裂面的参数
Table 4 Parameters of principal faults
主破裂面 走向/(°) 倾角/(°) 滑动角/(°) 破裂面1 178.01 81.72 116.58 破裂面2 208.17 41.05 -47.60
下载: 导出CSV
-
[1] 彭府华, 李庶林, 程建勇, 等. 中尺度复杂岩体应力波传播特性的微震试验研究[J]. 岩土工程学报, 2014, 36(2): 312-319. https://www.cnki.com.cn/Article/CJFDTOTAL-YTGC201402010.htm PENG Fu-hua, LI Shu-lin, CHENG Jian-yong, et al. Experimental study on characteristics of stress wave propagation in mesoscale and complex rock mass by micro-seismic monitoring[J]. Chinese Journal of Geotechnical Engineering, 2014, 36(2): 312-319. (in Chinese) https://www.cnki.com.cn/Article/CJFDTOTAL-YTGC201402010.htm
[2] 钱波, 杨莹, 徐奴文, 等. 白鹤滩水电站左岸边坡岩石损伤变形反馈分析[J]. 岩土工程学报, 2019, 41(8): 1464-1471. https://www.cnki.com.cn/Article/CJFDTOTAL-YTGC201908013.htm QIAN Bo, YANG Ying, XU Nu-wen, et al. Feedback analysis of rock damage deformation of slope at left bank of Baihetan Hydropower Station[J]. Chinese Journal of Geotechnical Engineering, 2019, 41(8): 1464-147. (in Chinese) https://www.cnki.com.cn/Article/CJFDTOTAL-YTGC201908013.htm
[3] 于洋, 冯夏庭, 陈炳瑞, 等. 深部岩体隧洞即时型岩爆微震震源体积的分形特征研究[J]. 岩土工程学报, 2017, 39(12): 2173-2179. https://www.cnki.com.cn/Article/CJFDTOTAL-YTGC201712005.htm YU Yang, FENG Xia-ting, CHENG Bin-rui, et al. Fractal characteristics of micro-seismic volume for different types of immediate rock-bursts in deep tunnels[J]. Chinese Journal of Geotechnical Engineering, 2017, 39(12): 2173-2179. (in Chinese) https://www.cnki.com.cn/Article/CJFDTOTAL-YTGC201712005.htm
[4] 陆菜平, 窦林名, 吴兴荣, 等. 岩体微震监测的频谱分析与信号识别[J]. 岩土工程学报, 2005, 27(7): 772-775. https://www.cnki.com.cn/Article/CJFDTOTAL-YTGC200507009.htm LU Cai-ping, DOU Lin-ming, WU Xing-rong, et al. Frequency spectrum analysis on microseismic monitoring and signal differentiation of rock material[J]. Chinese Journal of Geotechnical Engineering, 2005, 27(7): 772-775. (in Chinese) https://www.cnki.com.cn/Article/CJFDTOTAL-YTGC200507009.htm
[5] 吴顺川, 黄小庆, 陈钒, 等. 岩体破裂矩张量反演方法及其应用[J]. 岩土力学, 2016, 37(增刊1): 1-18. https://www.cnki.com.cn/Article/CJFDTOTAL-YTLX2016S1001.htm WU Shun-chuan, HUANG Xiao-qing, CHEN Fan, et al. Moment tensor inversion of rock failure and its application[J]. Rock and Soil Mechanics, 2016, 37(S1): 1-18. (in Chinese) https://www.cnki.com.cn/Article/CJFDTOTAL-YTLX2016S1001.htm
[6] 李庶林, 林恺帆, 周梦婧, 等. 基于矩张量分析的特大山体破坏前兆孕震机制研究[J]. 岩石力学与工程学报, 2019, 38(10): 2000-2009. https://www.cnki.com.cn/Article/CJFDTOTAL-YSLX201910007.htm LI Shu-lin, LIN Kai-fan, ZHOU Meng-jing, et al. Study on failure precursors and seismogenic mechanisms of a large landslidebased on moment tensor analysis[J]. Chinese Journal of Rock Mechanic and Engineering, 2019, 38(10): 2000-2009. (in Chinese) https://www.cnki.com.cn/Article/CJFDTOTAL-YSLX201910007.htm
[7] MCGARR A. Some applications of seismic sourcemechanism studies to assessing underground hazard[C]//Proceedings of First International Symposium on Rockbrust and Seismicity in Mines, 1984, Johannesburg.
[8] WALLACE R E. Geometry of shearing stress and relation to faulting[J]. The Journal of Geology, 1951, 59(2): 118-130.
[9] BOTT M H P. The mechanics of oblique slip faulting[J]. Geological Magazine, 1959, 96(2): 109-117.
[10] ANGELIER J. Determination of the mean principal directions of stresses for a given fault population[J]. Tectonophysics, 1979, 56(3/4): T17-T26.
[11] ETCHECOPAR A, VASSEUR G, DAIGNIERES M. An inverse problem in microtectonics for the determination of stress tensors from fault striation analysis[J]. Journal of Structural Geology, 1981, 3(1): 51-65.
[12] GEPHART J W, FORSYTH D W. An improved method for determining the regional stress tensor using earthquake focal mechanism data: application to the San Fernando earthquake sequence[J]. Journal of Geophysical Research: Solid Earth, 1984, 89(B11): 9305-9320.
[13] MICHAEL A J. Determination of stress from slip data: faults and folds[J]. Journal of Geophysical Research, 1984, 89(B13): 11517-11526.
[14] MICHAEL A J. Use of focal mechanisms to determine stress: a control study[J]. Journal of Geophysical Research: Solid Earth, 1987, 92(B1): 357-368.
[15] HARDEBECK J L, MICHAEL A J. Damped regional‐scale stress inversions: methodology and examples for southern California and the Coalinga aftershock sequence[J]. Journal of Geophysical Research: Solid Earth, 2006, 111(B11): 1-11.
[16] VAVRYČUK V. Iterative joint inversion for stress and fault orientations from focal mechanisms[J]. Geophysical Journal International, 2014, 199(1): 69-77.
[17] LAY T, WALLACE T C. Modern Global Seismology[M]. New York: Academic Press, 1995.
[18] LUND B, SLUNGA R. Stress tensor inversion using detailed microearthquake information and stability constraints: Application to Ölfus in southwest Iceland[J]. Journal of Geophysical Research: Solid Earth, 1999, 104(B7): 14947-14964.
[19] VAVRYČUK V, BOUCHAALA F, FISCHER T. High- resolution fault image from accurate locations and focal mechanisms of the 2008 swarm earthquakes in West Bohemia, Czech Republic[J]. Tectonophysics, 2013, 590: 189-195.
[20] VAVRYČUK V. Principal earthquakes: theory and observations from the 2008 west bohemia swarm[C]//AGU Fall Meeting Abstracts, 2011, San Francisco.
[21] VAVRYČUK V. Moment tensor decompositions revisited[J]. Journal of Seismology, 2015, 19(1): 231-252.


计量
- 文章访问数: 296
- HTML全文浏览量: 53
- PDF下载量: 276